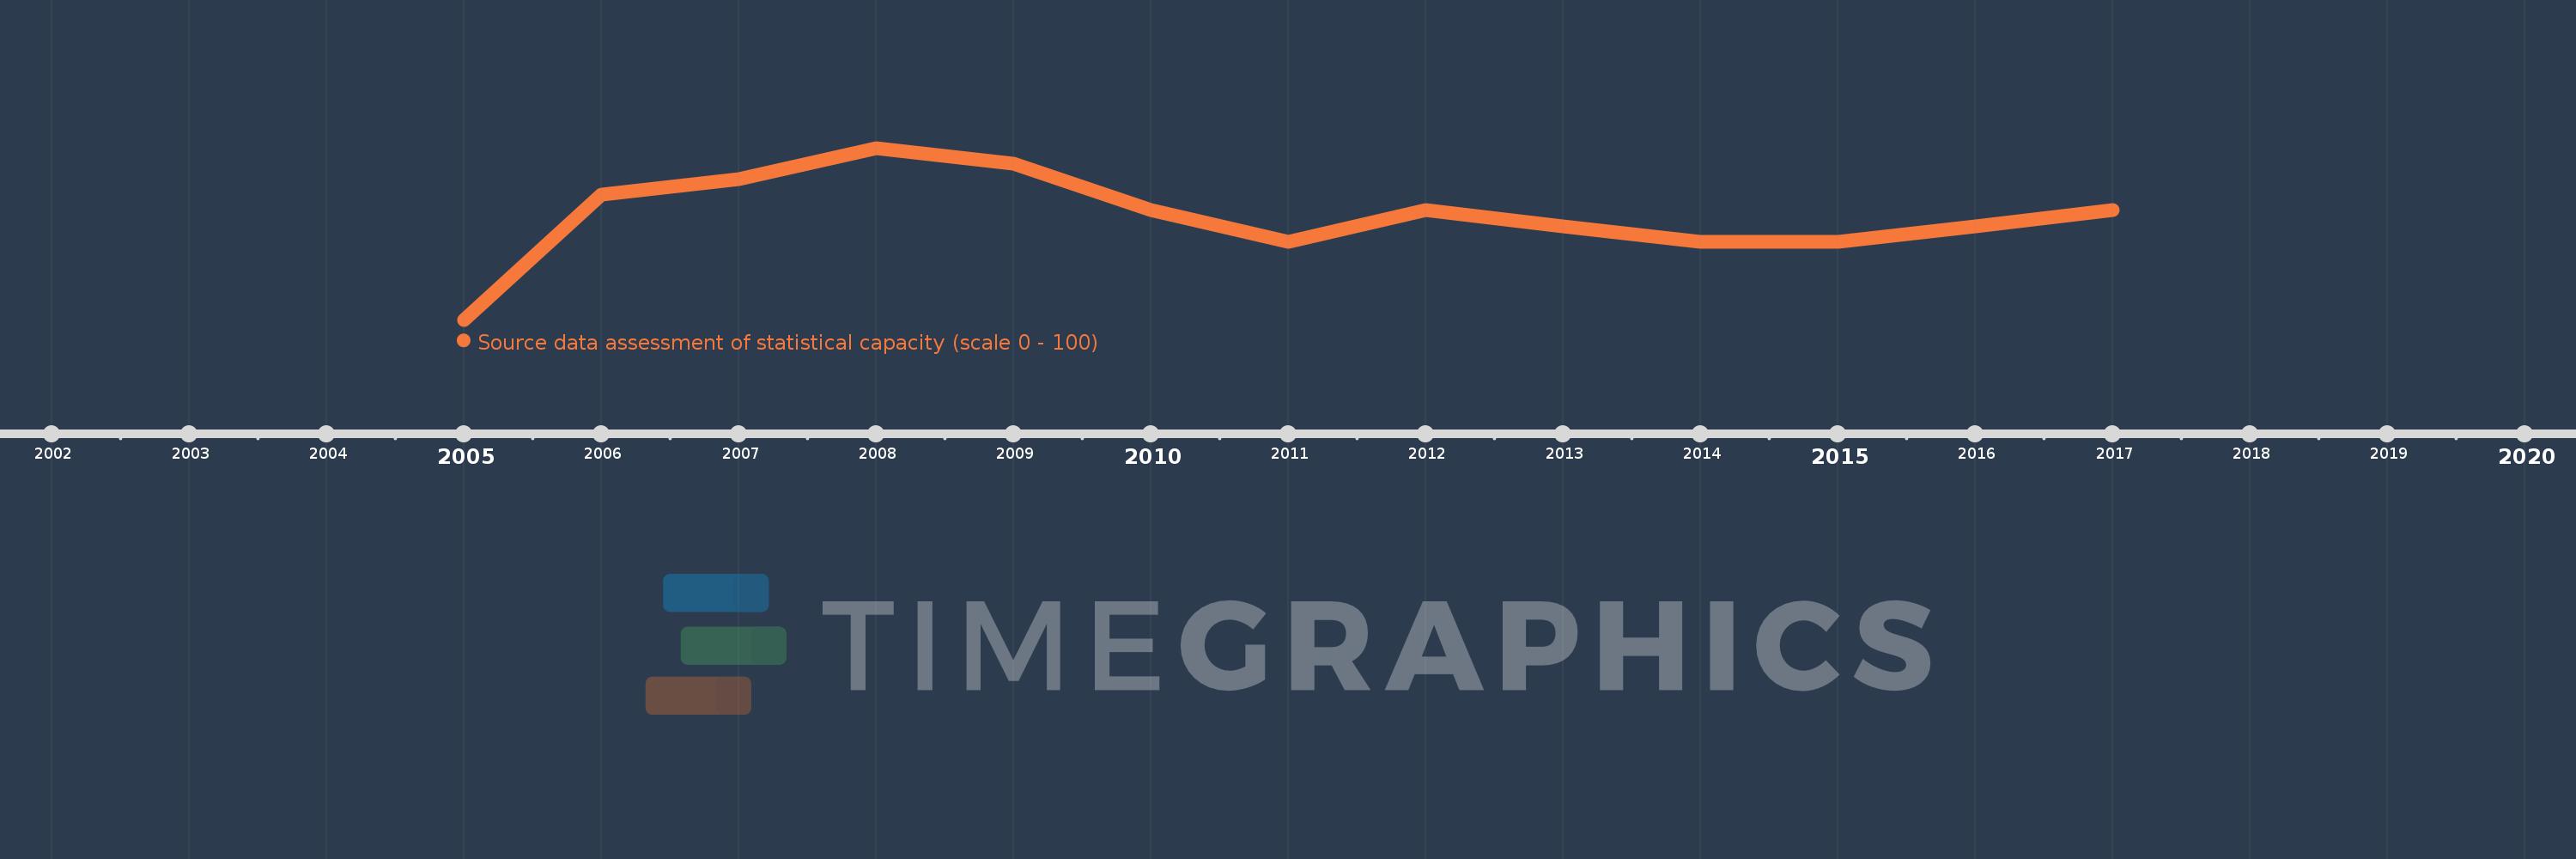
This timeline shows a graph from 2005 to 2017 of Middle East & North Africa (IDA & IBRD countries). No data until 2004. Number of actual observations by date: 13.
Source name:
World Development Indicators
Source organization:
World Bank
Categories, topics:
Public Sector
Last updated:
apr 23, 2017
Indicators value changes by year
Meaning:
58.741
Minimum:
52.727
jan 1, 2005
Maximum:
62.727
jan 1, 2008
At the date of observation
Value
Absolute change
Change from the previous value
jan 1, 2005
52.727
+52.727
0.0%
jan 1, 2006
60.0
+7.273
13.79%
jan 1, 2007
60.909
+0.909
1.52%
jan 1, 2008
62.727
+1.818
2.99%
jan 1, 2009
61.818
-0.909
-1.45%
jan 1, 2010
59.091
-2.727
-4.41%
jan 1, 2011
57.273
-1.818
-3.08%
jan 1, 2012
59.091
+1.818
3.17%
jan 1, 2013
58.182
-0.909
-1.54%
jan 1, 2014
57.273
-0.909
-1.56%
jan 1, 2015
57.273
0.0
0.0%
jan 1, 2016
58.182
+0.909
1.59%
jan 1, 2017
59.091
+0.909
1.56%
Ranking of countries by current statistics by years
