29
/
en
AIzaSyAYiBZKx7MnpbEhh9jyipgxe19OcubqV5w
April 1, 2024
37014
IBRD only
IBD
false
2
1
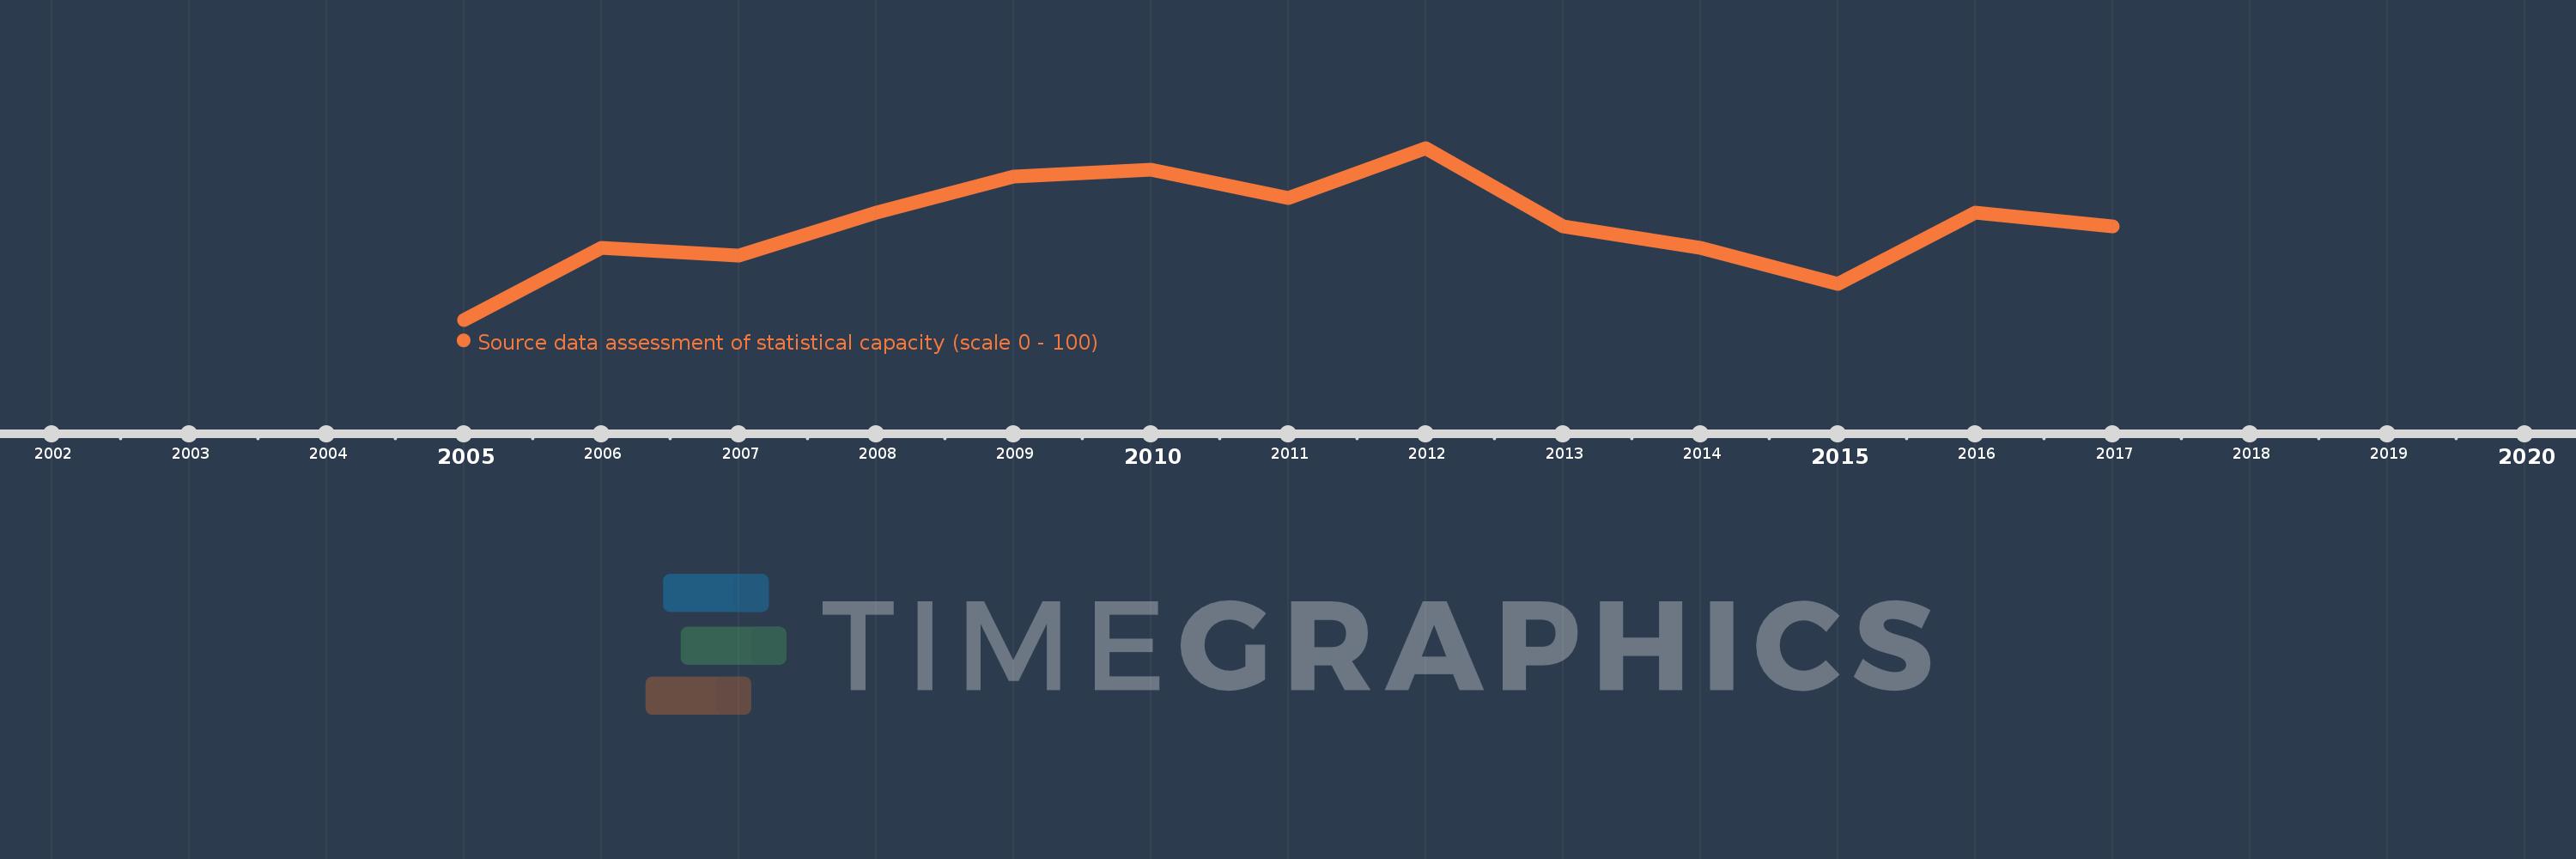
Source data assessment of statistical capacity (scale 0 - 100)
2017,2016,2015,2014,2013,2012,2011,2010,2009,2008,2007,2006,2005
This statistics in other country:
Timeline:
This timeline shows a graph from 2005 to 2017 of IBRD only. No data until 2004. Number of actual observations by date: 13.
Source name:
World Development Indicators
Source organization:
World Bank
Categories, topics:
Public Sector
Last updated:
apr 23, 2017
Indicators value changes by year
Minimum:
71.964
jan 1, 2005
At the date of observation
Value
Absolute change
Change from previous value
jan 1, 2005
71.964
+71.964
0.0%
jan 1, 2006
73.75
+1.786
2.48%
jan 1, 2007
73.571
-0.179
-0.24%
jan 1, 2008
74.643
+1.071
1.46%
jan 1, 2009
75.536
+0.893
1.2%
jan 1, 2010
75.714
+0.179
0.24%
jan 1, 2011
75.0
-0.714
-0.94%
jan 1, 2012
76.25
+1.25
1.67%
jan 1, 2013
74.286
-1.964
-2.58%
jan 1, 2014
73.75
-0.536
-0.72%
jan 1, 2015
72.857
-0.893
-1.21%
jan 1, 2016
74.643
+1.786
2.45%
jan 1, 2017
74.286
-0.357
-0.48%
Ranking of countries by current statistics by years


Comments: