29
/
en
AIzaSyAYiBZKx7MnpbEhh9jyipgxe19OcubqV5w
April 1, 2024
51996
North America
NAC
false
2
1
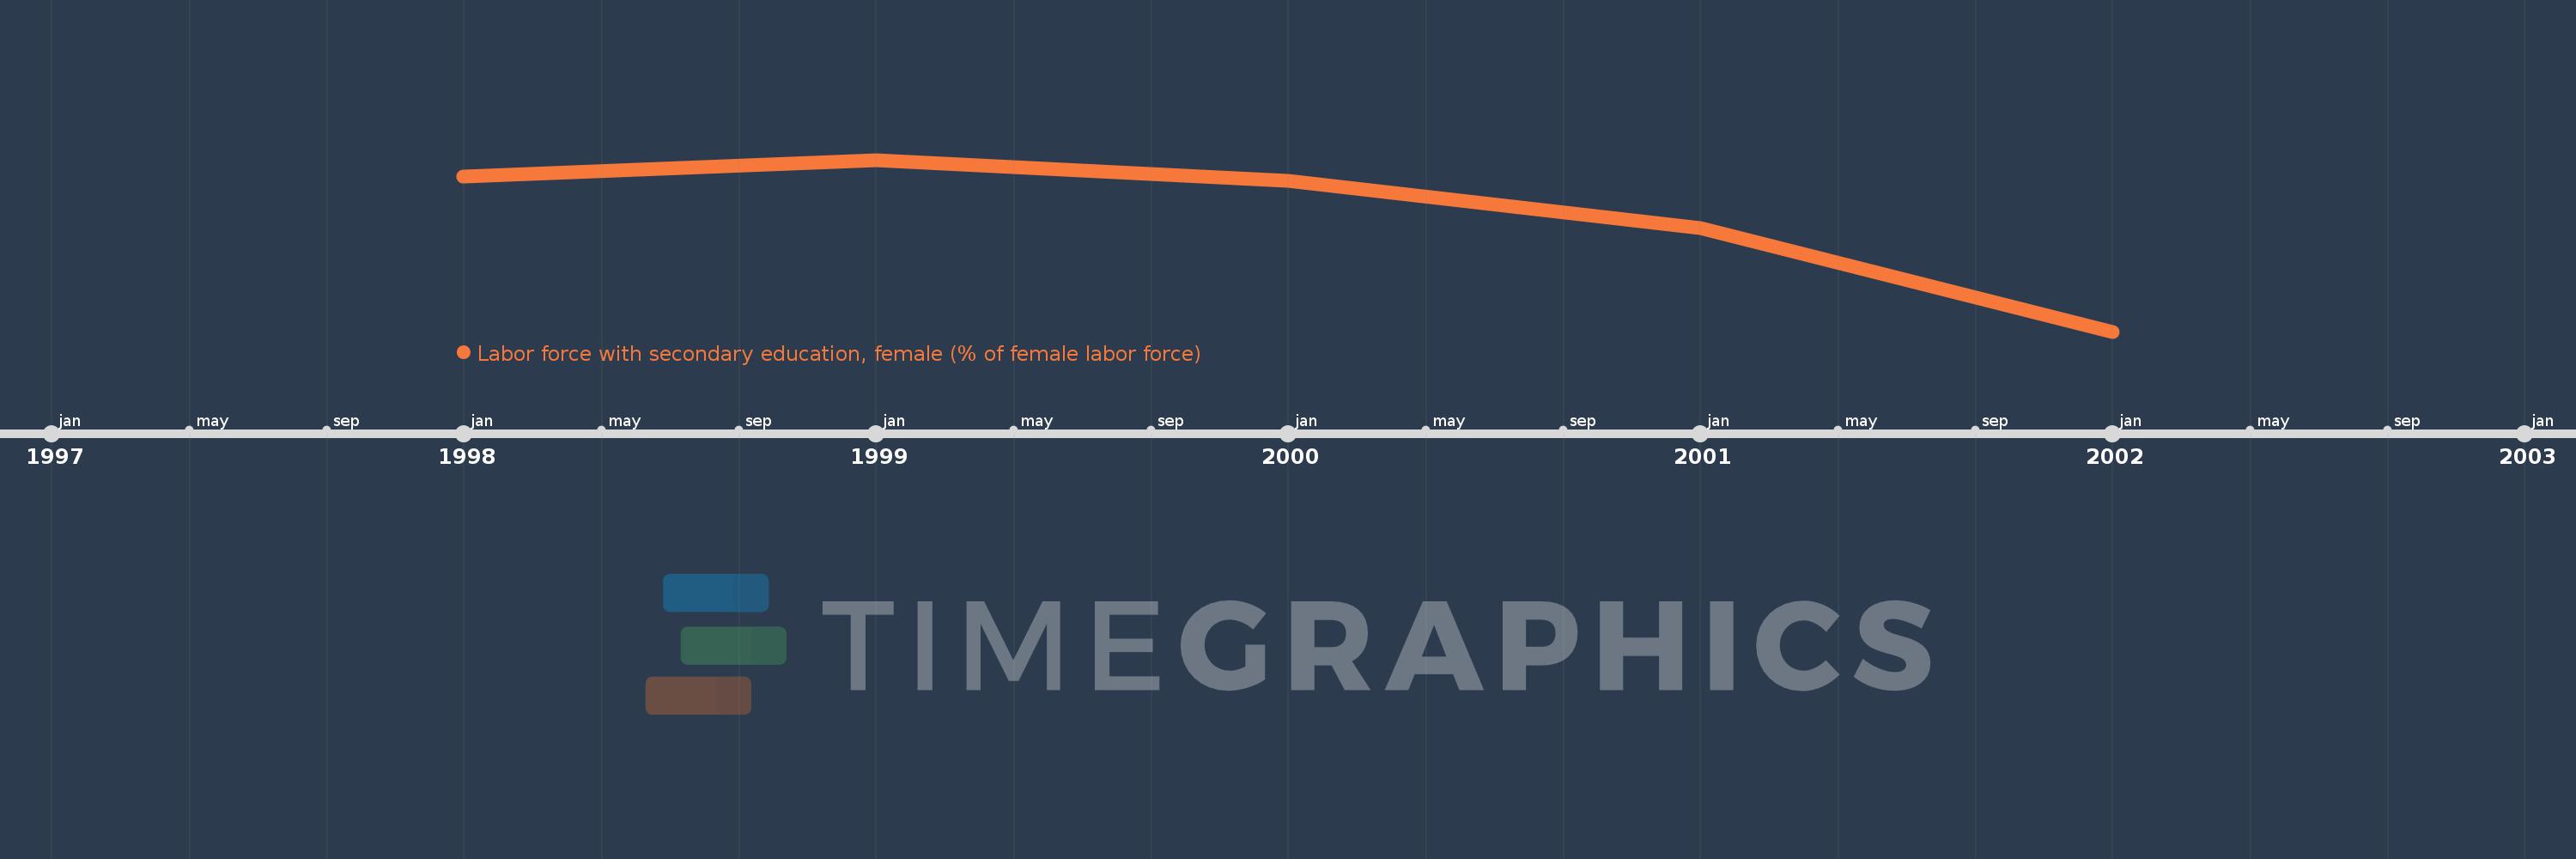
Labor force with secondary education, female (% of female labor force)
2002,2001,2000,1999,1998
This statistics in other country:
Timeline:
This timeline shows a graph from 1998 to 2002 of North America. No data until 1997. Number of actual observations by date: 5.
Source name:
World Development Indicators
Source organization:
International Labour Organization, Key Indicators of the Labour Market database.
Categories, topics:
Education, Social Protection & Labor, Gender
Last updated:
apr 23, 2017
Indicators value changes by year
Minimum:
50.402
jan 1, 2002
Maximum:
52.068
jan 1, 1999
At the date of observation
Value
Absolute change
Change from previous value
jan 1, 1998
51.909
+51.909
0.0%
jan 1, 1999
52.068
+0.159
0.31%
jan 1, 2000
51.864
-0.205
-0.39%
jan 1, 2001
51.404
-0.46
-0.89%
jan 1, 2002
50.402
-1.002
-1.95%
Ranking of countries by current statistics by years


Comments: