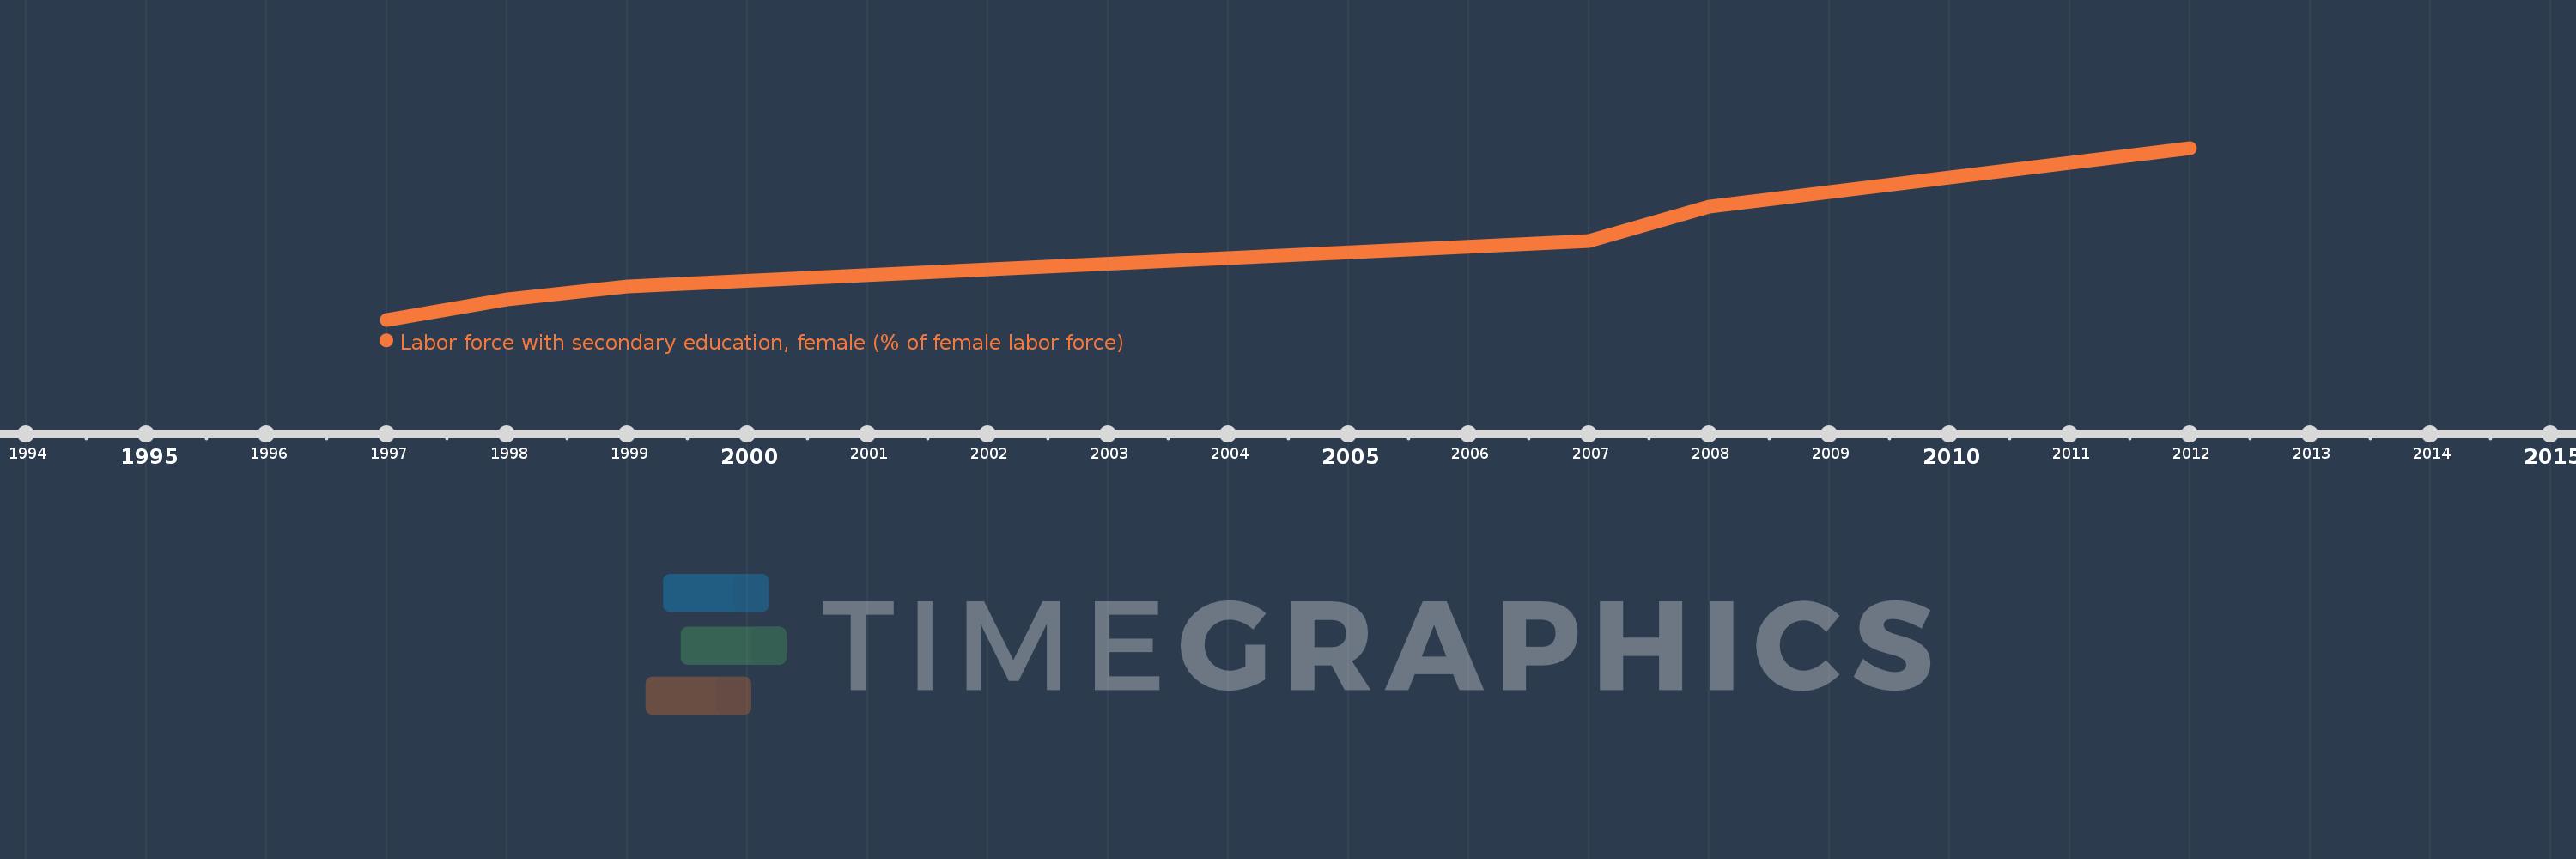
This timeline shows a graph from 1997 to 2012 of Latin America & Caribbean (excluding high income). No data until 1996. Number of actual observations by date: 6.
Source name:
World Development Indicators
Source organization:
International Labour Organization, Key Indicators of the Labour Market database.
Categories, topics:
Education, Social Protection & Labor, Gender
Last updated:
apr 23, 2017
Indicators value changes by year
Meaning:
30.271
Minimum:
23.94
jan 1, 1997
Maximum:
39.604
jan 1, 2012
At the date of observation
Value
Absolute change
Change from the previous value
jan 1, 1997
23.94
+23.94
0.0%
jan 1, 1998
25.764
+1.824
7.62%
jan 1, 1999
26.968
+1.204
4.67%
jan 1, 2007
31.114
+4.146
15.37%
jan 1, 2008
34.238
+3.124
10.04%
jan 1, 2012
39.604
+5.366
15.67%
Ranking of countries by current statistics by years
