29
/
en
AIzaSyAYiBZKx7MnpbEhh9jyipgxe19OcubqV5w
April 1, 2024
32758
Europe & Central Asia (IDA & IBRD countries)
TEC
false
2
1
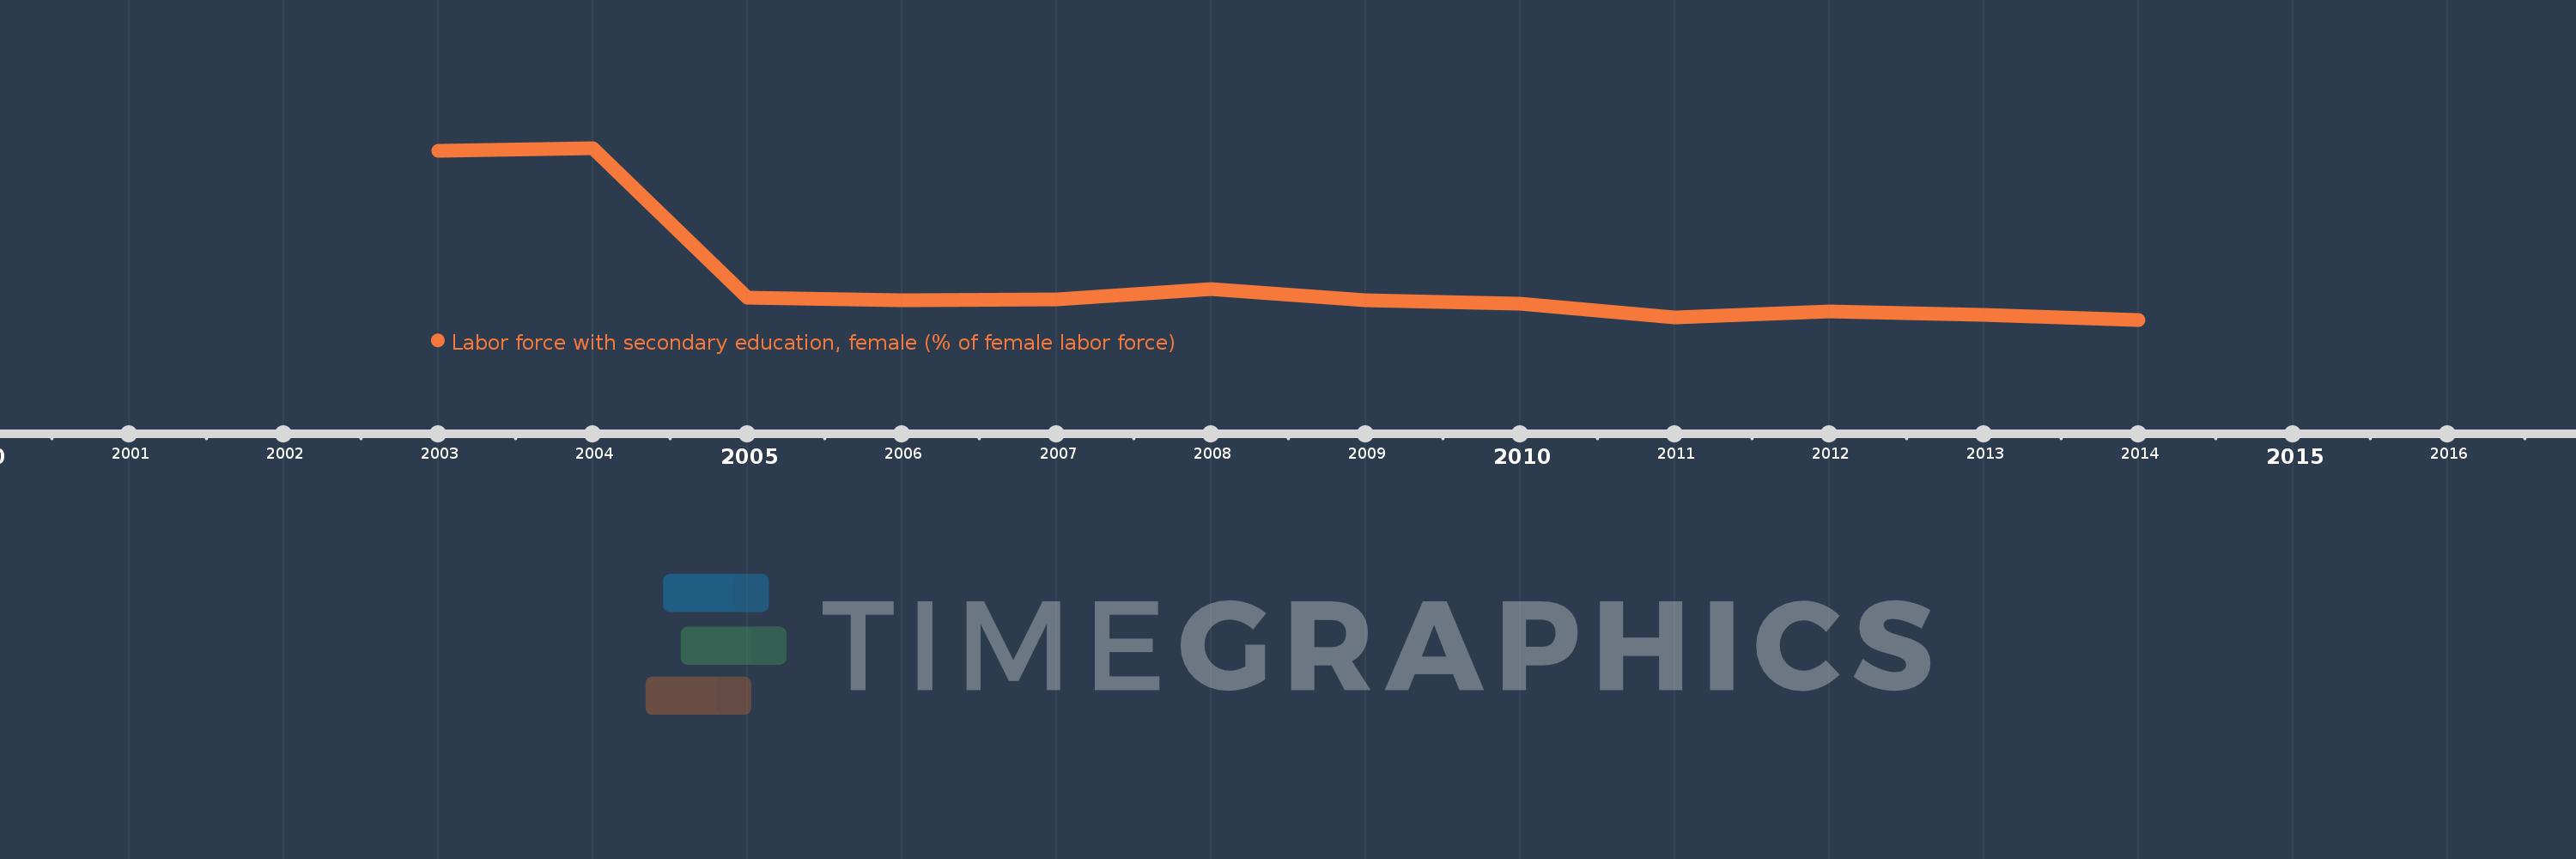
Labor force with secondary education, female (% of female labor force)
2014,2013,2012,2011,2010,2009,2008,2007,2006,2005,2004,2003
This statistics in other country:
Timeline:
This timeline shows a graph from 2003 to 2014 of Europe & Central Asia (IDA & IBRD countries). No data until 2002. Number of actual observations by date: 12.
Source name:
World Development Indicators
Source organization:
International Labour Organization, Key Indicators of the Labour Market database.
Categories, topics:
Education, Social Protection & Labor, Gender
Last updated:
apr 23, 2017
Indicators value changes by year
Minimum:
38.206
jan 1, 2014
Maximum:
57.992
jan 1, 2004
At the date of observation
Value
Absolute change
Change from previous value
jan 1, 2003
57.678
+57.678
0.0%
jan 1, 2004
57.992
+0.314
0.54%
jan 1, 2005
40.782
-17.209
-29.68%
jan 1, 2006
40.46
-0.322
-0.79%
jan 1, 2007
40.544
+0.083
0.21%
jan 1, 2008
41.745
+1.201
2.96%
jan 1, 2009
40.493
-1.252
-3.0%
jan 1, 2010
40.01
-0.483
-1.19%
jan 1, 2011
38.432
-1.578
-3.94%
jan 1, 2012
39.197
+0.765
1.99%
jan 1, 2013
38.796
-0.401
-1.02%
jan 1, 2014
38.206
-0.59
-1.52%
Ranking of countries by current statistics by years


Comments: