29
/
en
AIzaSyAYiBZKx7MnpbEhh9jyipgxe19OcubqV5w
April 1, 2024
51971
North America
NAC
false
2
1
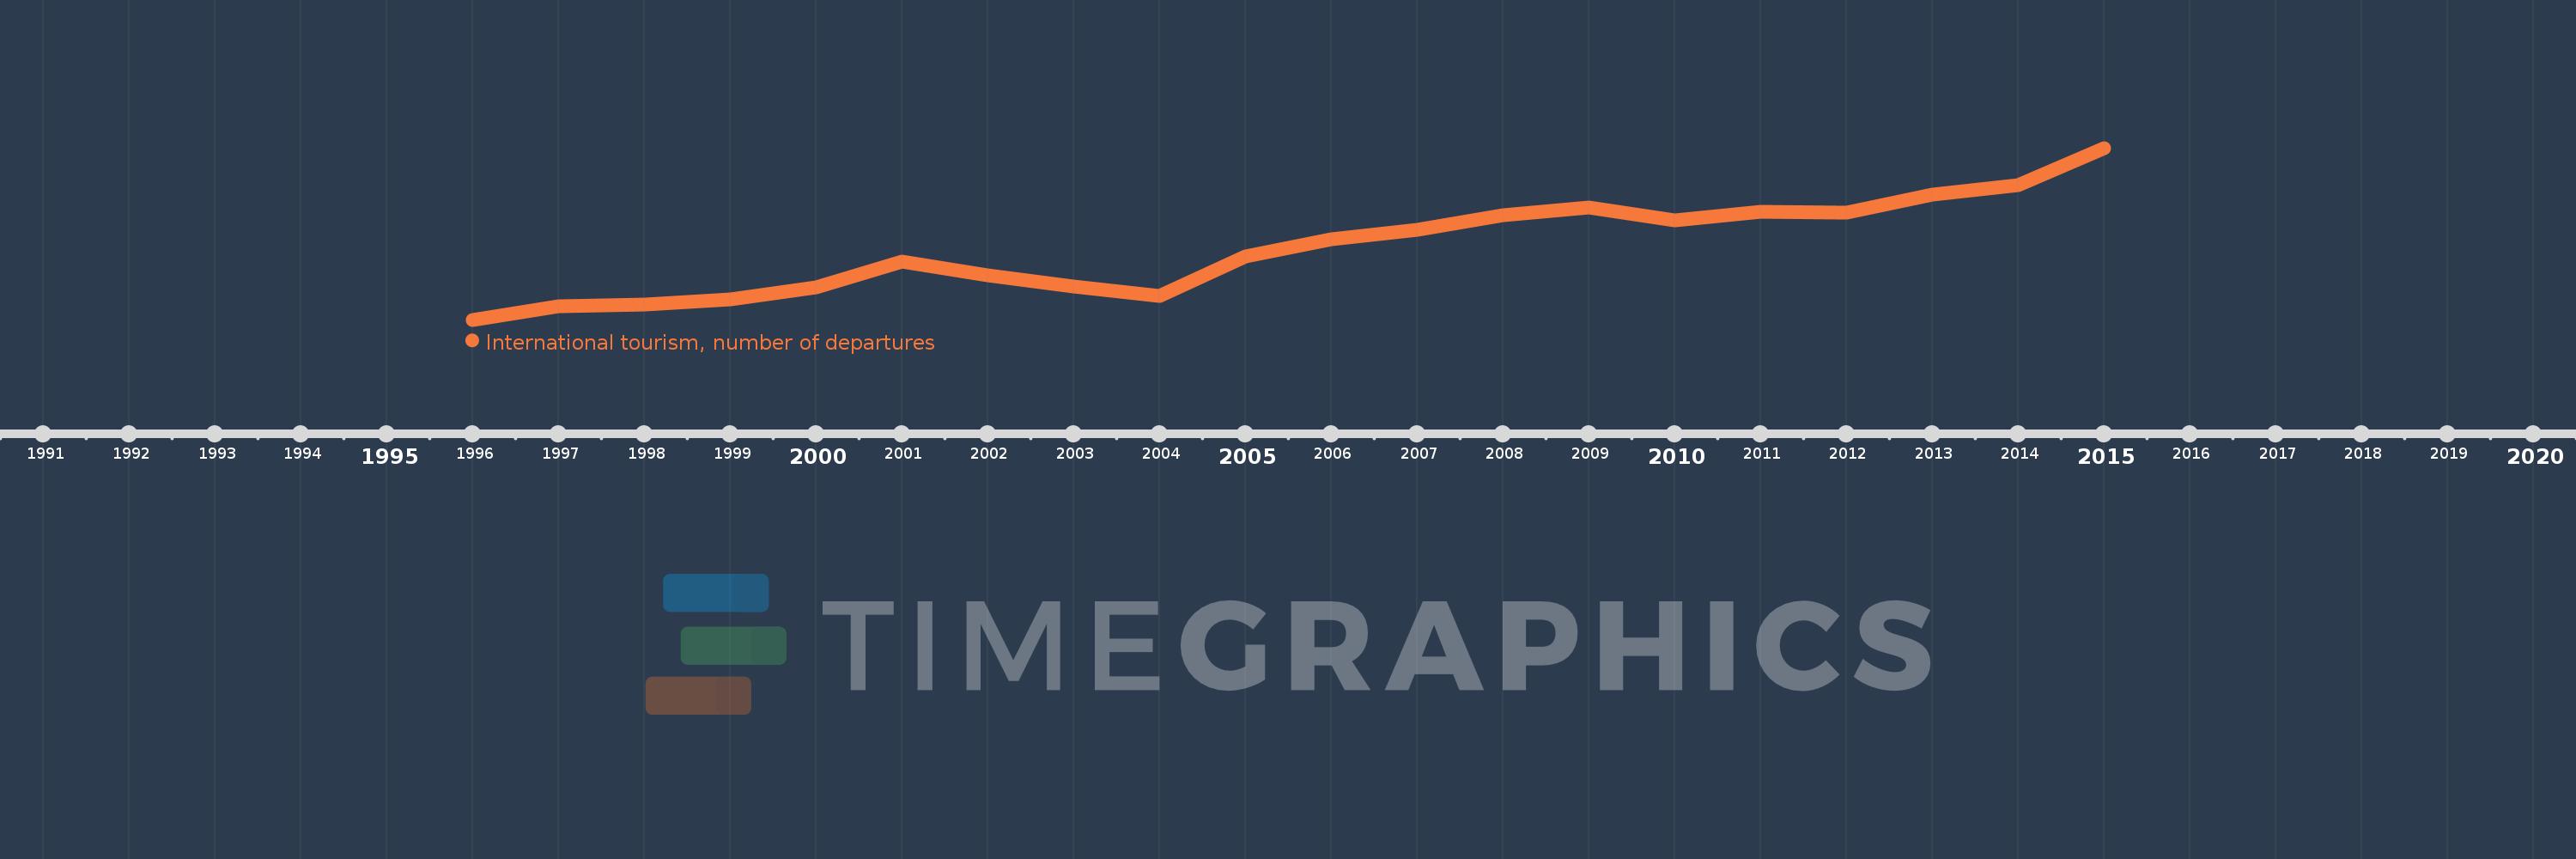
International tourism, number of departures
2015,2014,2013,2012,2011,2010,2009,2008,2007,2006,2005,2004,2003,2002,2001,2000,1999,1998,1997,1996
This statistics in other country:
Timeline:
This timeline shows a graph from 1996 to 2015 of North America. No data until 1995. Number of actual observations by date: 20.
Source name:
World Development Indicators
Source organization:
World Tourism Organization, Yearbook of Tourism Statistics, Compendium of Tourism Statistics and data files.
Categories, topics:
Private Sector, Trade
Last updated:
apr 23, 2017
Indicators value changes by year
Minimum:
69.482 mln
jan 1, 1996
Maximum:
101.84 mln
jan 1, 2015
At the date of observation
Value
Absolute change
Change from previous value
jan 1, 1996
69.482 mln
+69.482 mln
0.0%
jan 1, 1997
71.963 mln
+2.481 mln
3.57%
jan 1, 1998
72.331 mln
+367.953K
0.51%
jan 1, 1999
73.335 mln
+1.004 mln
1.39%
jan 1, 2000
75.58 mln
+2.246 mln
3.06%
jan 1, 2001
80.499 mln
+4.918 mln
6.51%
jan 1, 2002
77.791 mln
-2.708 mln
-3.36%
jan 1, 2003
75.77 mln
-2.021 mln
-2.6%
jan 1, 2004
73.987 mln
-1.783 mln
-2.35%
jan 1, 2005
81.403 mln
+7.416 mln
10.02%
jan 1, 2006
84.6 mln
+3.197 mln
3.93%
jan 1, 2007
86.398 mln
+1.798 mln
2.12%
jan 1, 2008
89.221 mln
+2.824 mln
3.27%
jan 1, 2009
90.704 mln
+1.483 mln
1.66%
jan 1, 2010
88.272 mln
-2.432 mln
-2.68%
jan 1, 2011
89.758 mln
+1.486 mln
1.68%
jan 1, 2012
89.676 mln
-82.016K
-0.09%
jan 1, 2013
92.991 mln
+3.315 mln
3.7%
jan 1, 2014
94.863 mln
+1.872 mln
2.01%
jan 1, 2015
101.84 mln
+6.977 mln
7.36%
Ranking of countries by current statistics by years


Comments: