29
/
en
AIzaSyAYiBZKx7MnpbEhh9jyipgxe19OcubqV5w
April 1, 2024
287398
Zimbabwe
ZWE
true
2
1
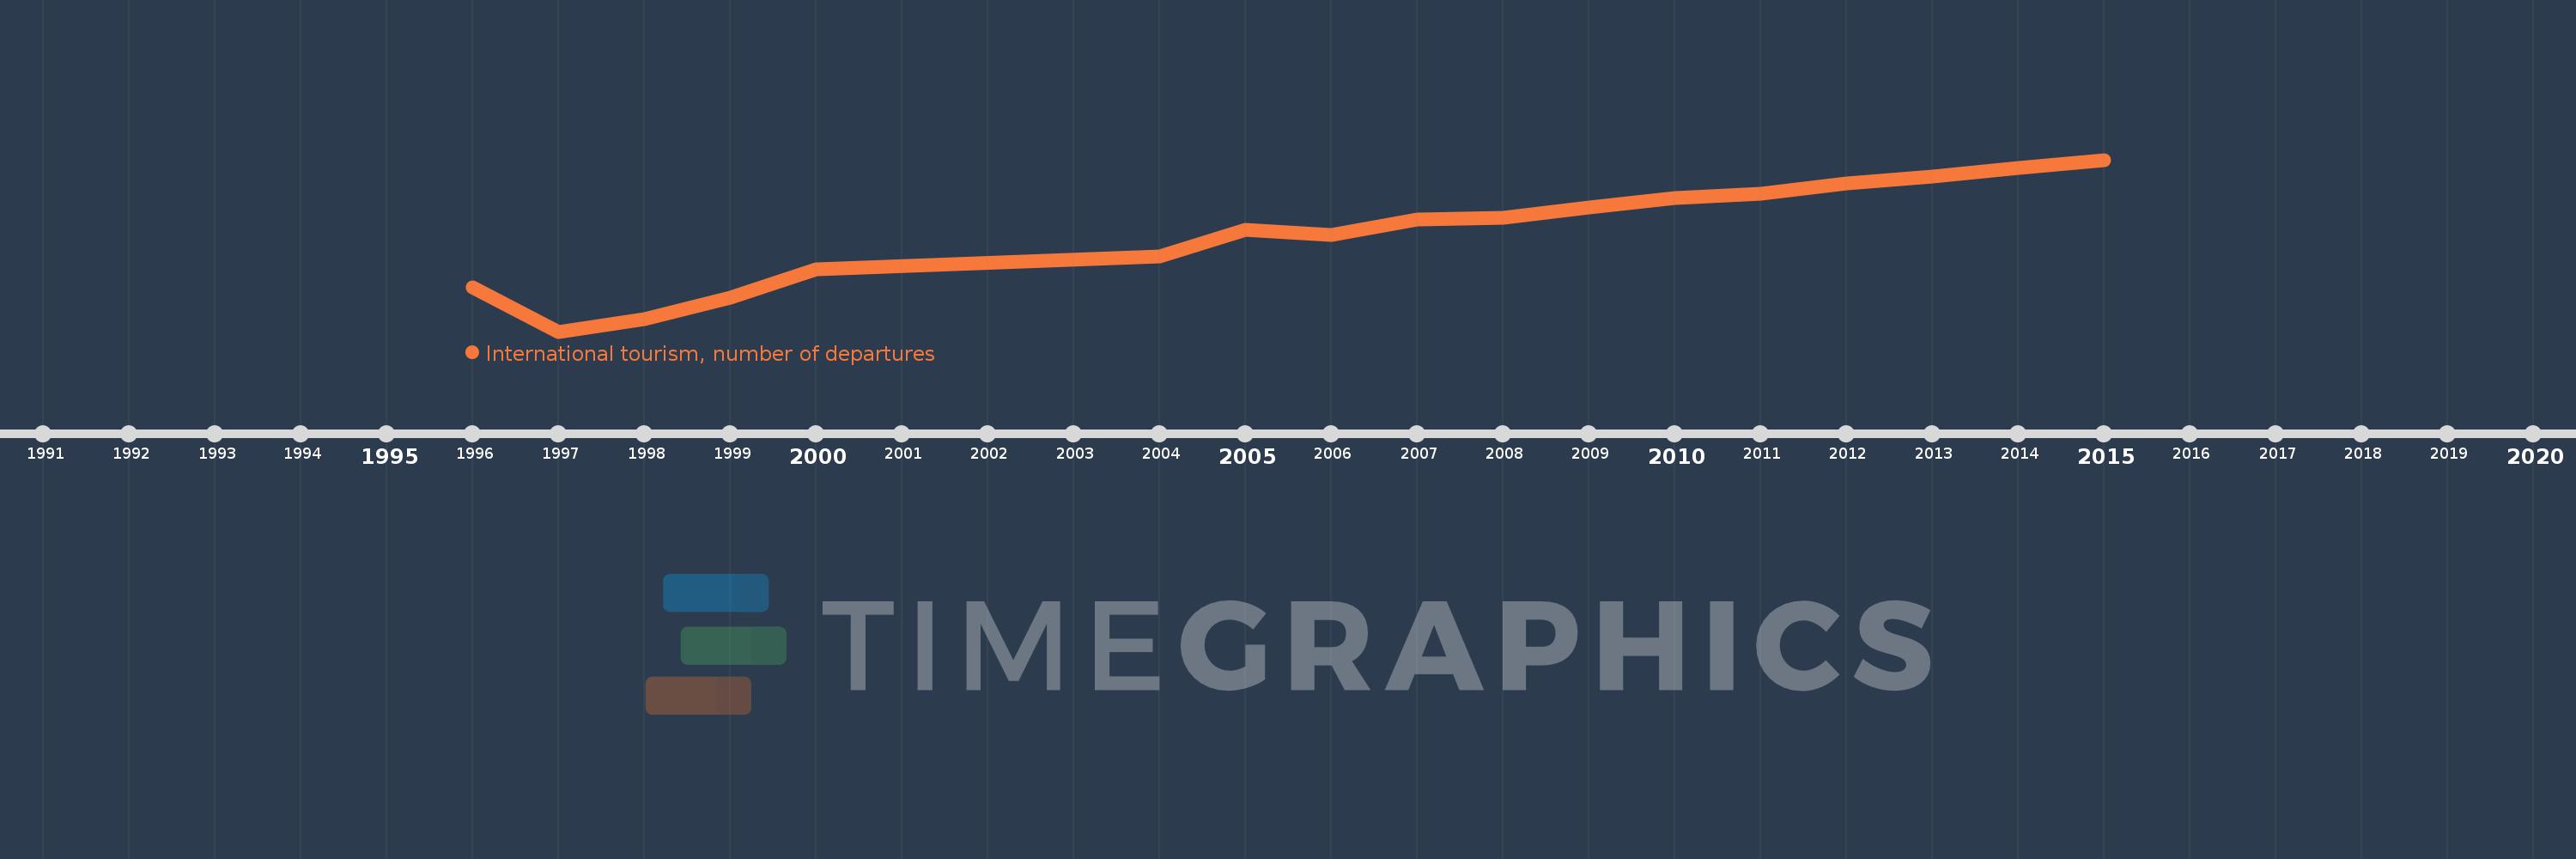
International tourism, number of departures
2015,2014,2013,2012,2011,2010,2009,2008,2007,2006,2005,2004,2000,1999,1998,1997,1996
This statistics in other country:
Timeline:
This timeline shows a graph from 1996 to 2015 of Zimbabwe. No data until 1995. Number of actual observations by date: 17.
Source name:
World Development Indicators
Source organization:
World Tourism Organization, Yearbook of Tourism Statistics, Compendium of Tourism Statistics and data files.
Categories, topics:
Private Sector, Trade
Last updated:
apr 23, 2017
Indicators value changes by year
Maximum:
792.0K
jan 1, 2015
At the date of observation
Value
Absolute change
Change from previous value
jan 1, 1996
256.0K
+256.0K
0.0%
jan 1, 1997
69.0K
-187.0K
-73.05%
jan 1, 1998
123.0K
+54.0K
78.26%
jan 1, 1999
213.0K
+90.0K
73.17%
jan 1, 2000
331.0K
+118.0K
55.4%
jan 1, 2004
386.0K
+55.0K
16.62%
jan 1, 2005
498.0K
+112.0K
29.02%
jan 1, 2006
474.0K
-24.0K
-4.82%
jan 1, 2007
541.0K
+67.0K
14.14%
jan 1, 2008
547.0K
+6.0K
1.11%
jan 1, 2009
593.0K
+46.0K
8.41%
jan 1, 2010
631.0K
+38.0K
6.41%
jan 1, 2011
650.0K
+19.0K
3.01%
jan 1, 2012
693.0K
+43.0K
6.62%
jan 1, 2013
720.0K
+27.0K
3.9%
jan 1, 2014
757.0K
+37.0K
5.14%
jan 1, 2015
792.0K
+35.0K
4.62%
Ranking of countries by current statistics by years


Comments: