29
/
en
AIzaSyAYiBZKx7MnpbEhh9jyipgxe19OcubqV5w
April 1, 2024
31730
Europe & Central Asia (excluding high income)
ECA
false
2
1
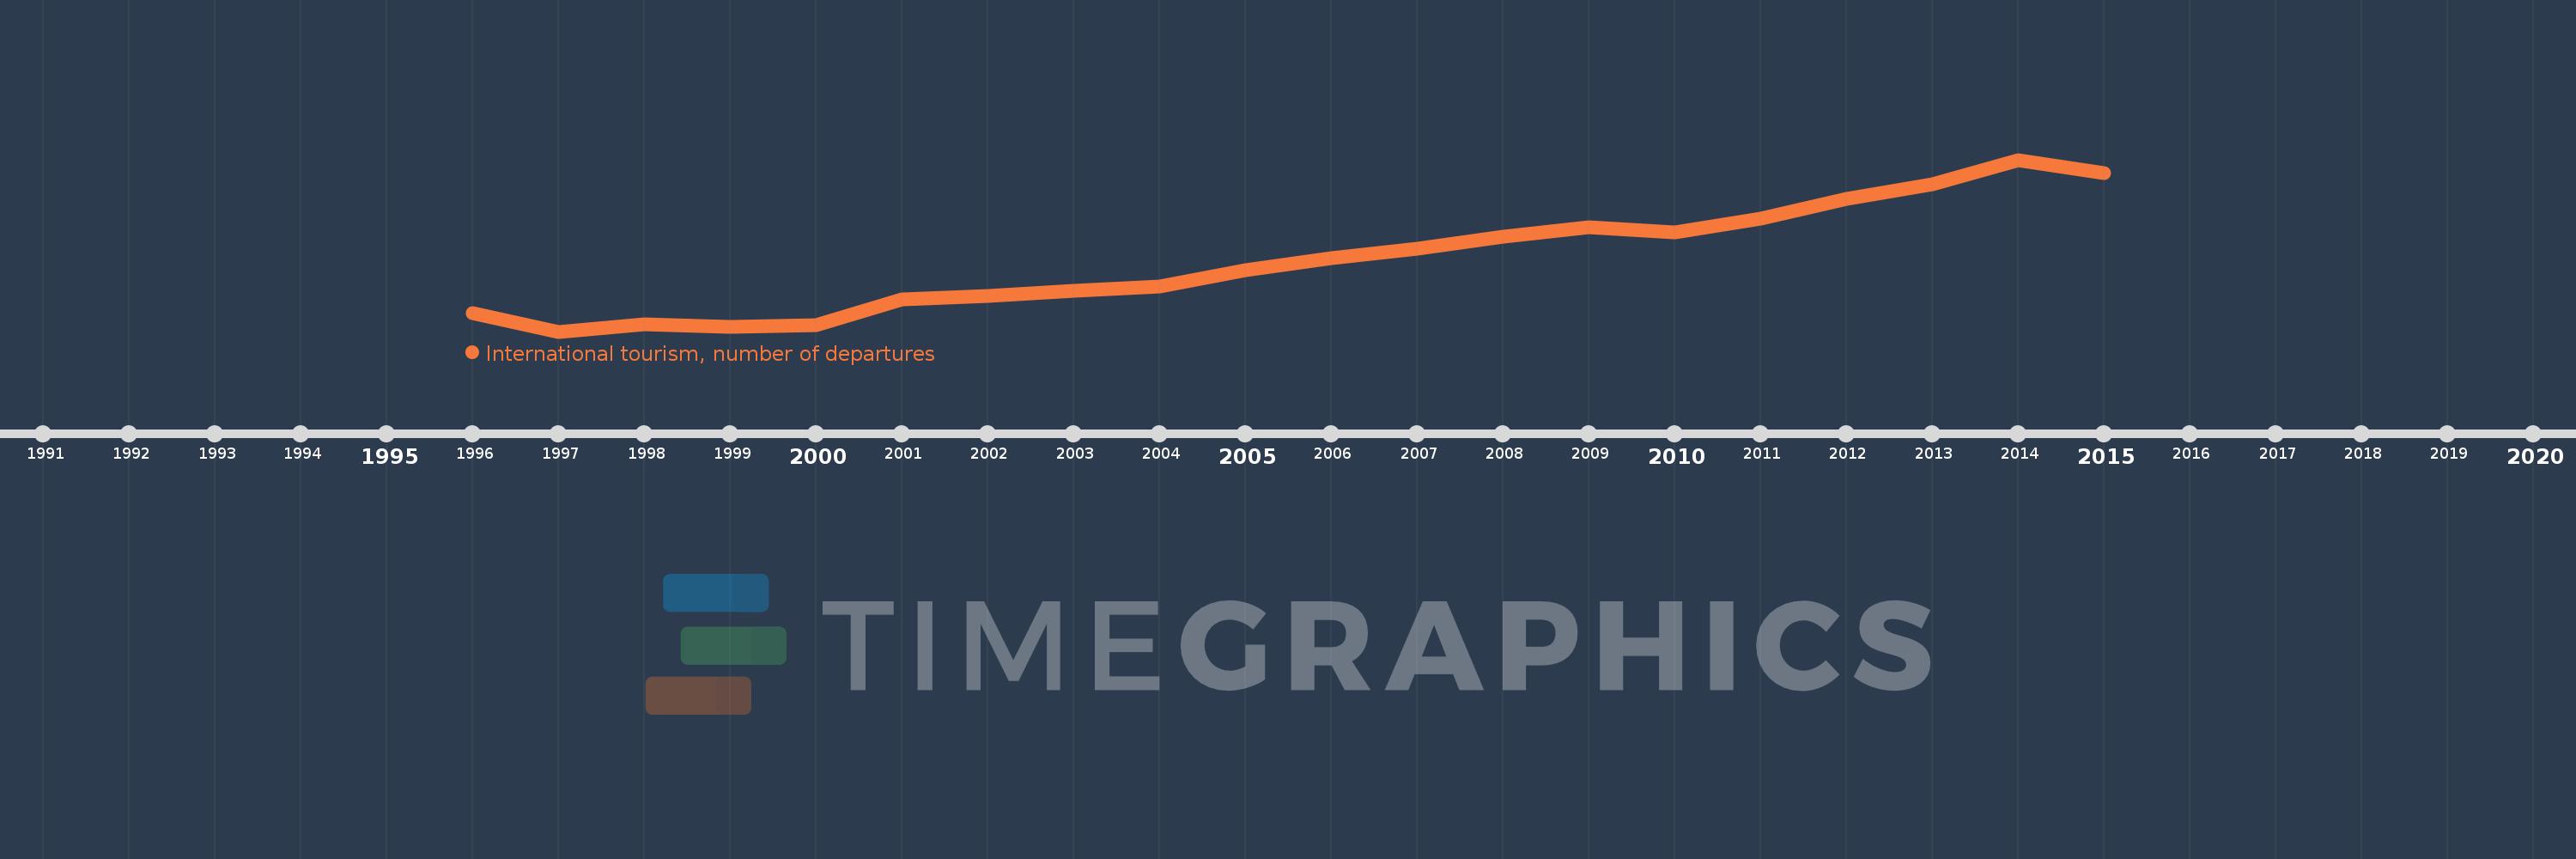
International tourism, number of departures
2015,2014,2013,2012,2011,2010,2009,2008,2007,2006,2005,2004,2003,2002,2001,2000,1999,1998,1997,1996
This statistics in other country:
Timeline:
This timeline shows a graph from 1996 to 2015 of Europe & Central Asia (excluding high income). No data until 1995. Number of actual observations by date: 20.
Source name:
World Development Indicators
Source organization:
World Tourism Organization, Yearbook of Tourism Statistics, Compendium of Tourism Statistics and data files.
Categories, topics:
Private Sector, Trade
Last updated:
apr 23, 2017
Indicators value changes by year
Minimum:
36.5 mln
jan 1, 1997
Maximum:
137.207 mln
jan 1, 2014
At the date of observation
Value
Absolute change
Change from previous value
jan 1, 1996
47.552 mln
+47.552 mln
0.0%
jan 1, 1997
36.5 mln
-11.053 mln
-23.24%
jan 1, 1998
40.862 mln
+4.363 mln
11.95%
jan 1, 1999
39.39 mln
-1.473 mln
-3.6%
jan 1, 2000
40.322 mln
+932.343K
2.37%
jan 1, 2001
55.342 mln
+15.02 mln
37.25%
jan 1, 2002
57.537 mln
+2.196 mln
3.97%
jan 1, 2003
60.621 mln
+3.084 mln
5.36%
jan 1, 2004
63.13 mln
+2.508 mln
4.14%
jan 1, 2005
72.414 mln
+9.284 mln
14.71%
jan 1, 2006
79.543 mln
+7.129 mln
9.84%
jan 1, 2007
85.033 mln
+5.49 mln
6.9%
jan 1, 2008
91.978 mln
+6.945 mln
8.17%
jan 1, 2009
97.474 mln
+5.496 mln
5.98%
jan 1, 2010
94.45 mln
-3.024 mln
-3.1%
jan 1, 2011
102.807 mln
+8.357 mln
8.85%
jan 1, 2012
114.244 mln
+11.437 mln
11.13%
jan 1, 2013
122.942 mln
+8.698 mln
7.61%
jan 1, 2014
137.207 mln
+14.265 mln
11.6%
jan 1, 2015
129.211 mln
-7.996 mln
-5.83%
Ranking of countries by current statistics by years


Comments: