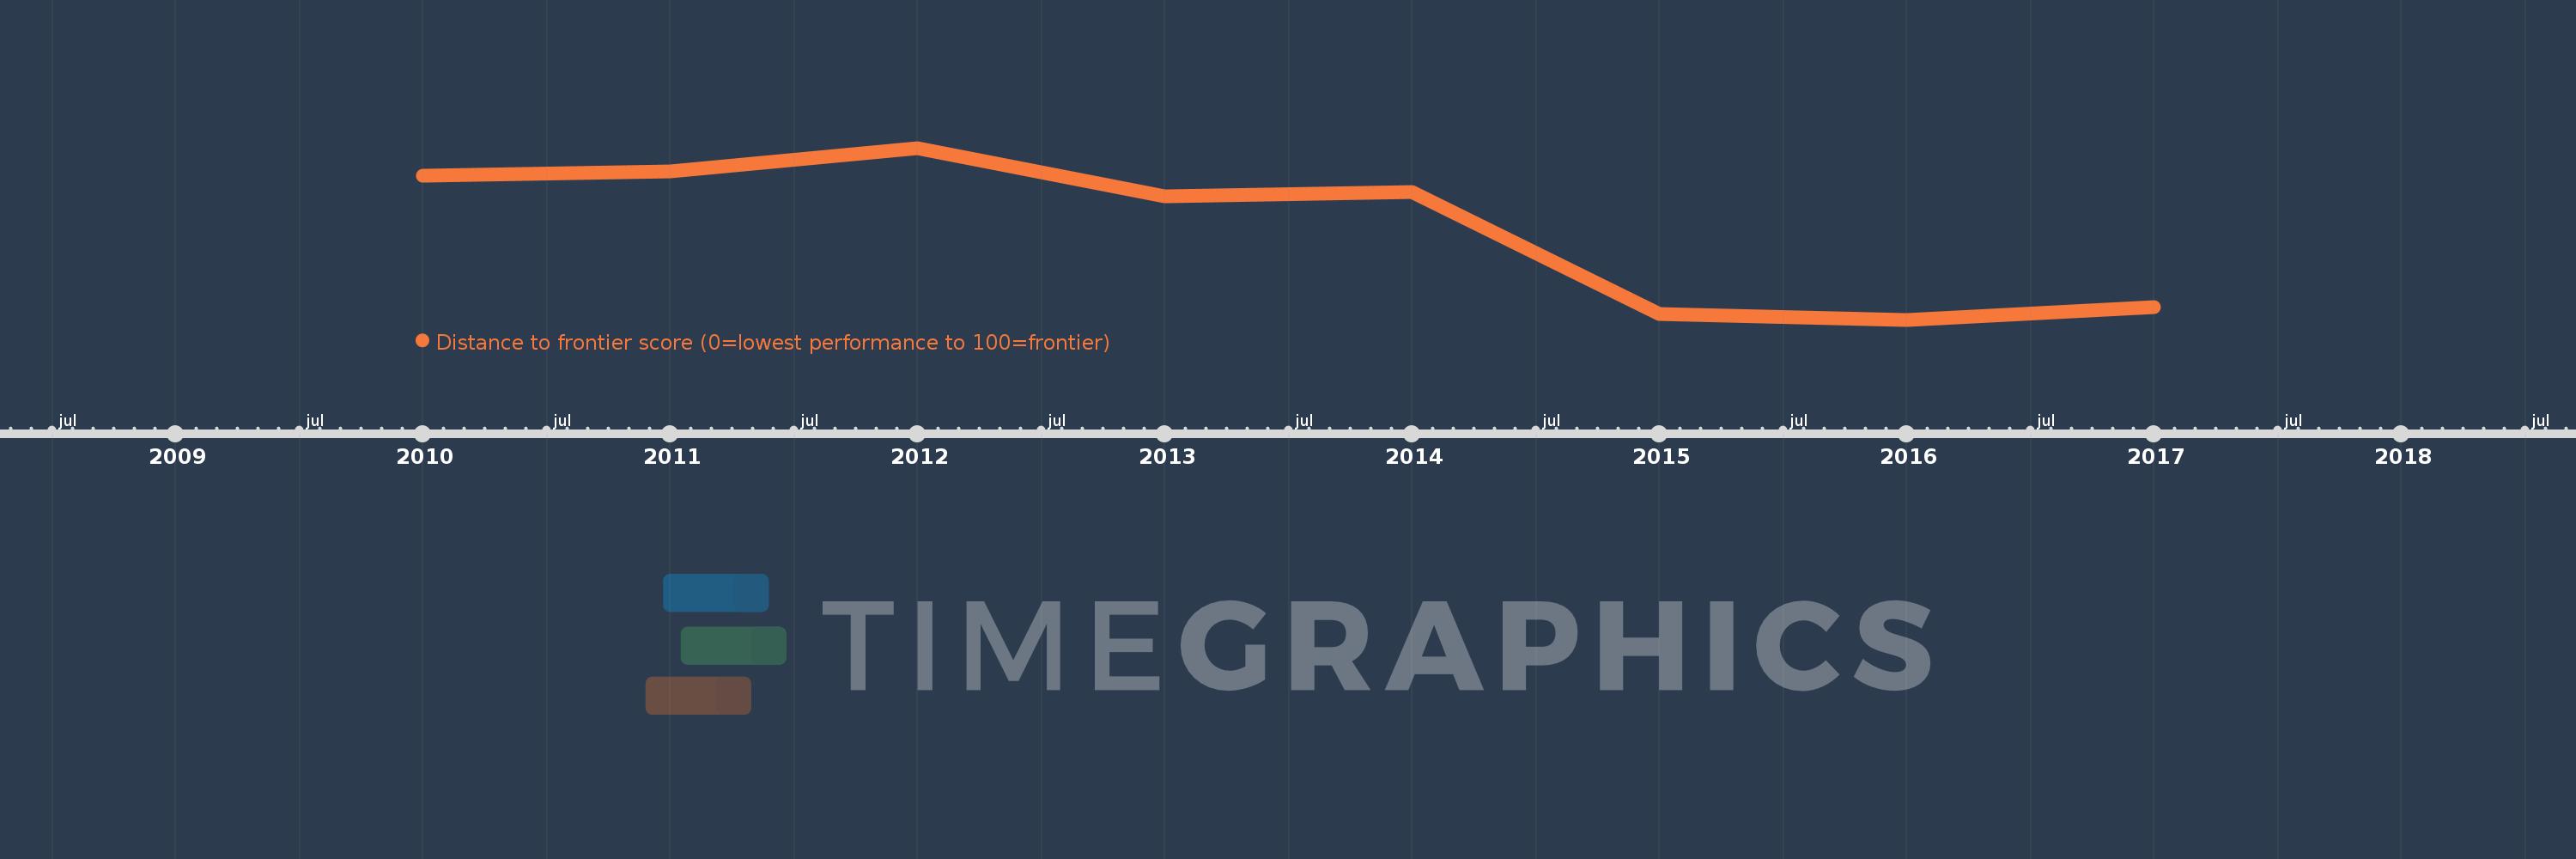
This timeline shows a graph from 2010 to 2017 of Middle East & North Africa (IDA & IBRD countries). No data until 2009. Number of actual observations by date: 8.
Source name:
World Development Indicators
Source organization:
World Bank, Doing Business project (http://www.doingbusiness.org/).
Categories, topics:
Private Sector
Last updated:
apr 23, 2017
Indicators value changes by year
Meaning:
53.652
Minimum:
50.54
jan 1, 2016
Maximum:
56.364
jan 1, 2012
At the date of observation
Value
Absolute change
Change from the previous value
jan 1, 2010
55.432
+55.432
0.0%
jan 1, 2011
55.571
+0.139
0.25%
jan 1, 2012
56.364
+0.793
1.43%
jan 1, 2013
54.736
-1.628
-2.89%
jan 1, 2014
54.884
+0.148
0.27%
jan 1, 2015
50.729
-4.155
-7.57%
jan 1, 2016
50.54
-0.189
-0.37%
jan 1, 2017
50.962
+0.422
0.84%
Ranking of countries by current statistics by years
