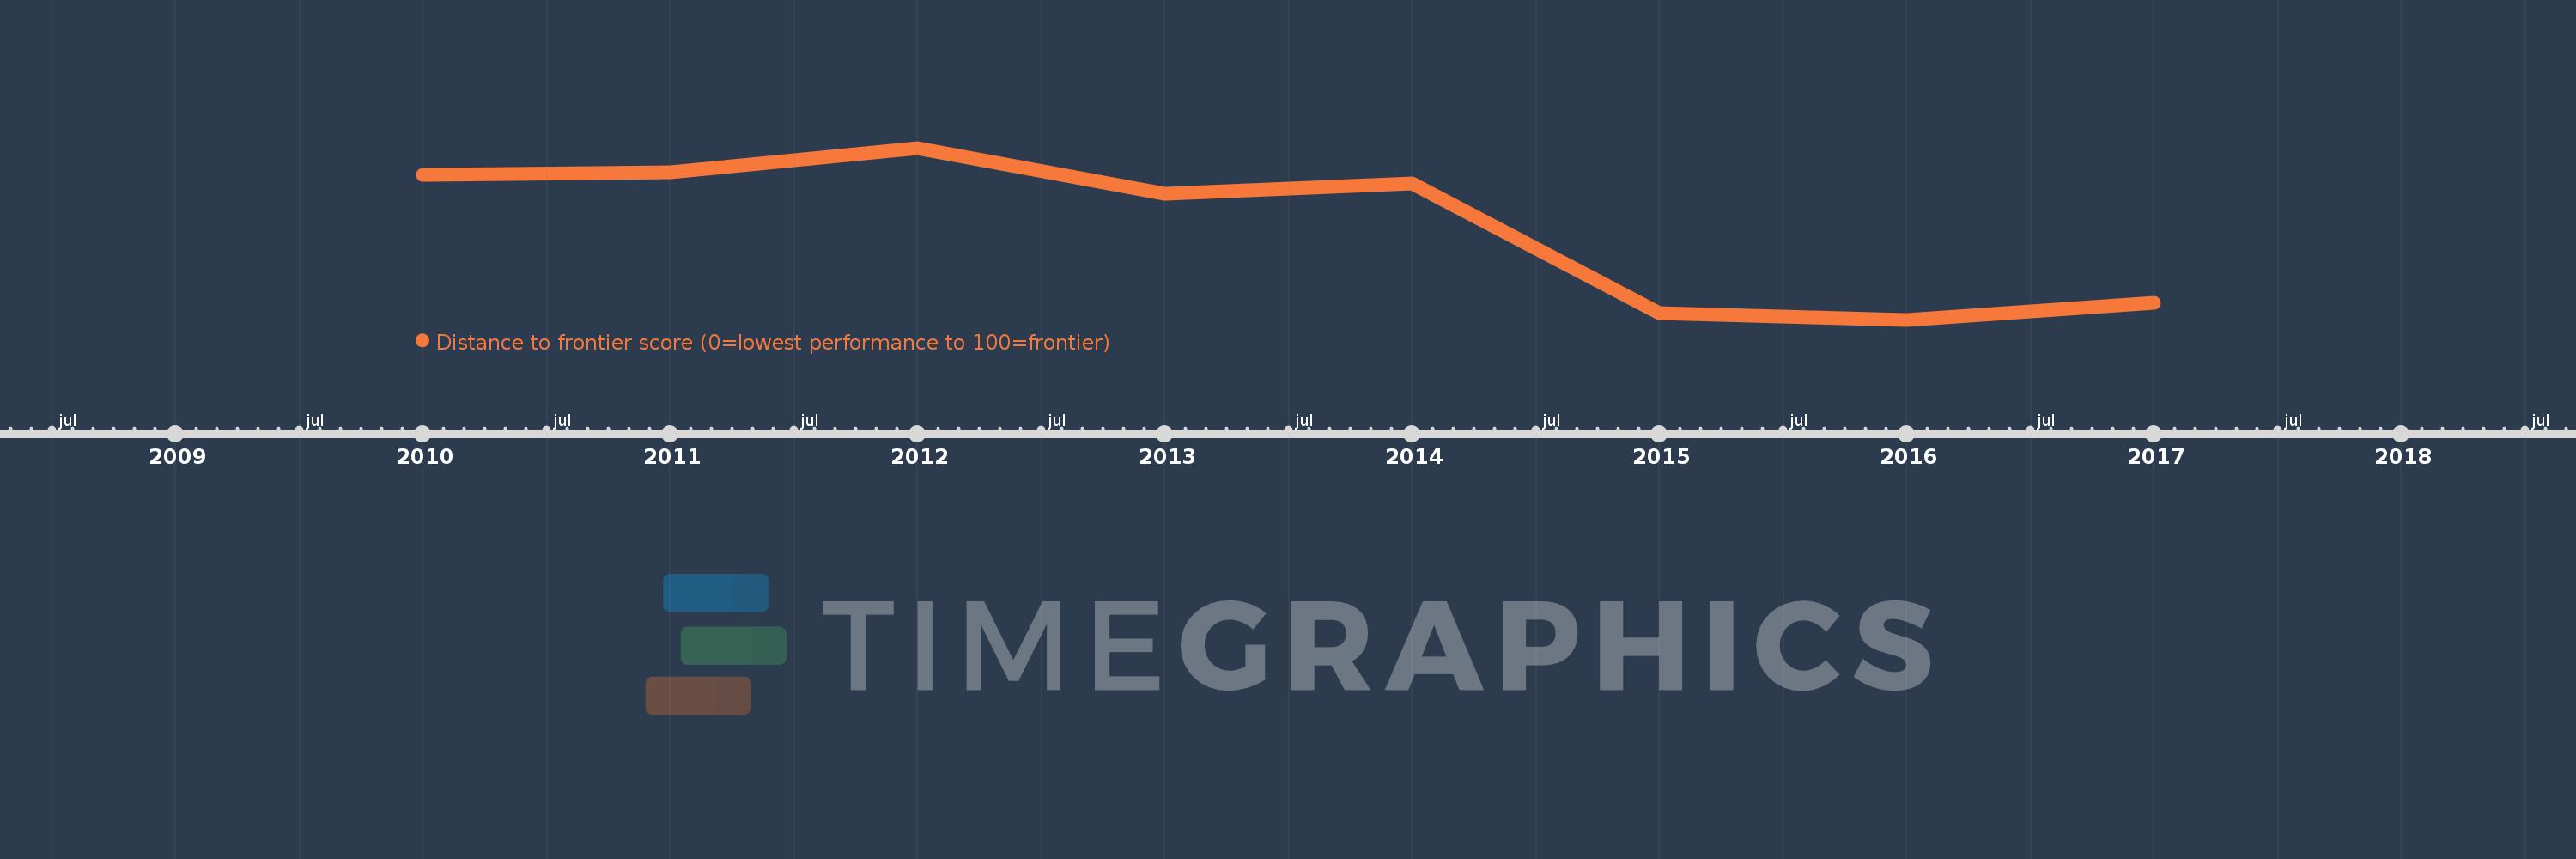
This timeline shows a graph from 2010 to 2017 of Middle East & North Africa (excluding high income). No data until 2009. Number of actual observations by date: 8.
Source name:
World Development Indicators
Source organization:
World Bank, Doing Business project (http://www.doingbusiness.org/).
Categories, topics:
Private Sector
Last updated:
apr 23, 2017
Indicators value changes by year
Meaning:
53.45
Minimum:
50.638
jan 1, 2016
Maximum:
55.803
jan 1, 2012
At the date of observation
Value
Absolute change
Change from the previous value
jan 1, 2010
54.984
+54.984
0.0%
jan 1, 2011
55.072
+0.087
0.16%
jan 1, 2012
55.803
+0.732
1.33%
jan 1, 2013
54.415
-1.388
-2.49%
jan 1, 2014
54.73
+0.315
0.58%
jan 1, 2015
50.825
-3.905
-7.14%
jan 1, 2016
50.638
-0.187
-0.37%
jan 1, 2017
51.135
+0.498
0.98%
Ranking of countries by current statistics by years
