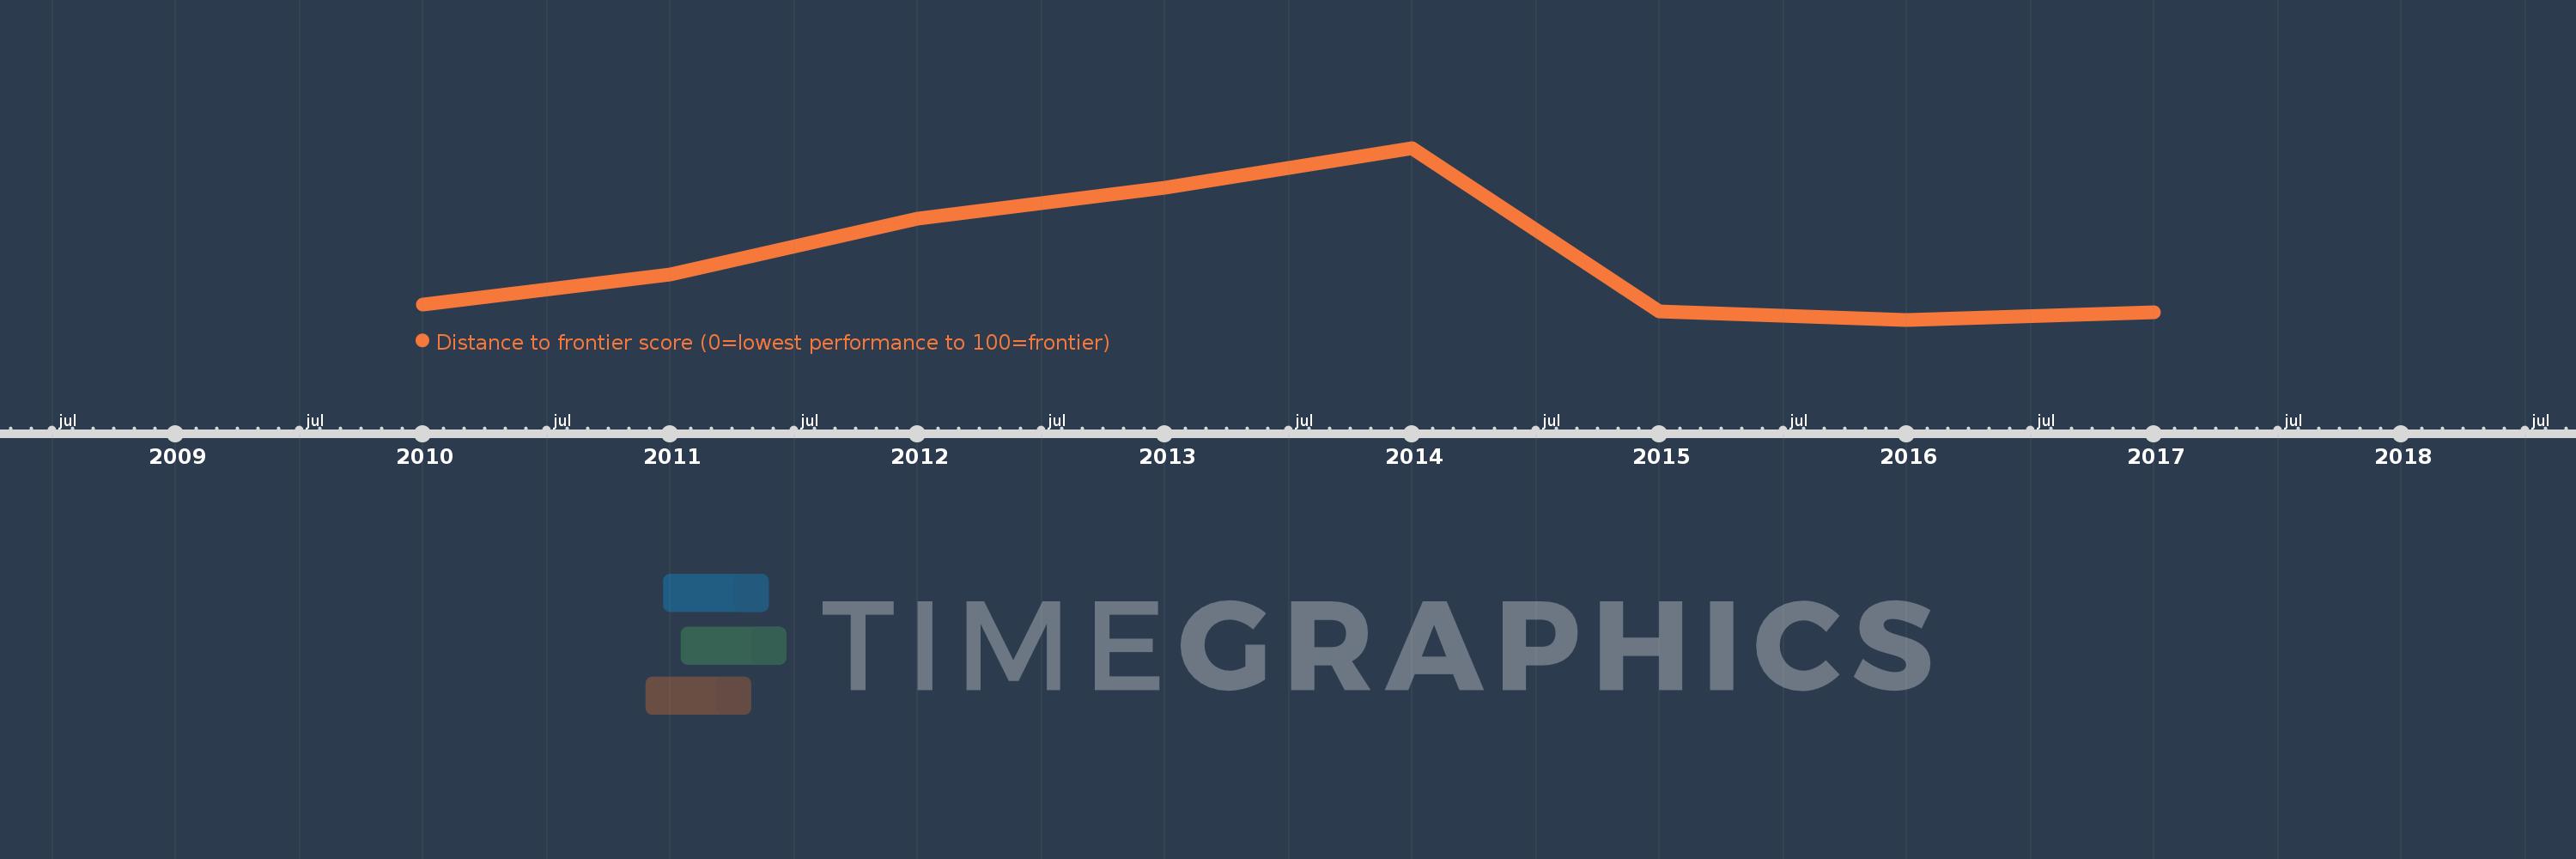
This timeline shows a graph from 2010 to 2017 of Latin America & the Caribbean (IDA & IBRD countries). No data until 2009. Number of actual observations by date: 8.
Source name:
World Development Indicators
Source organization:
World Bank, Doing Business project (http://www.doingbusiness.org/).
Categories, topics:
Private Sector
Last updated:
apr 23, 2017
Indicators value changes by year
Meaning:
59.395
Minimum:
58.785
jan 1, 2016
Maximum:
60.532
jan 1, 2014
At the date of observation
Value
Absolute change
Change from the previous value
jan 1, 2010
58.94
+58.94
0.0%
jan 1, 2011
59.241
+0.301
0.51%
jan 1, 2012
59.811
+0.57
0.96%
jan 1, 2013
60.125
+0.314
0.53%
jan 1, 2014
60.532
+0.407
0.68%
jan 1, 2015
58.868
-1.664
-2.75%
jan 1, 2016
58.785
-0.082
-0.14%
jan 1, 2017
58.858
+0.073
0.12%
Ranking of countries by current statistics by years
