29
/
en
AIzaSyAYiBZKx7MnpbEhh9jyipgxe19OcubqV5w
April 1, 2024
45995
Low income
LIC
false
2
1
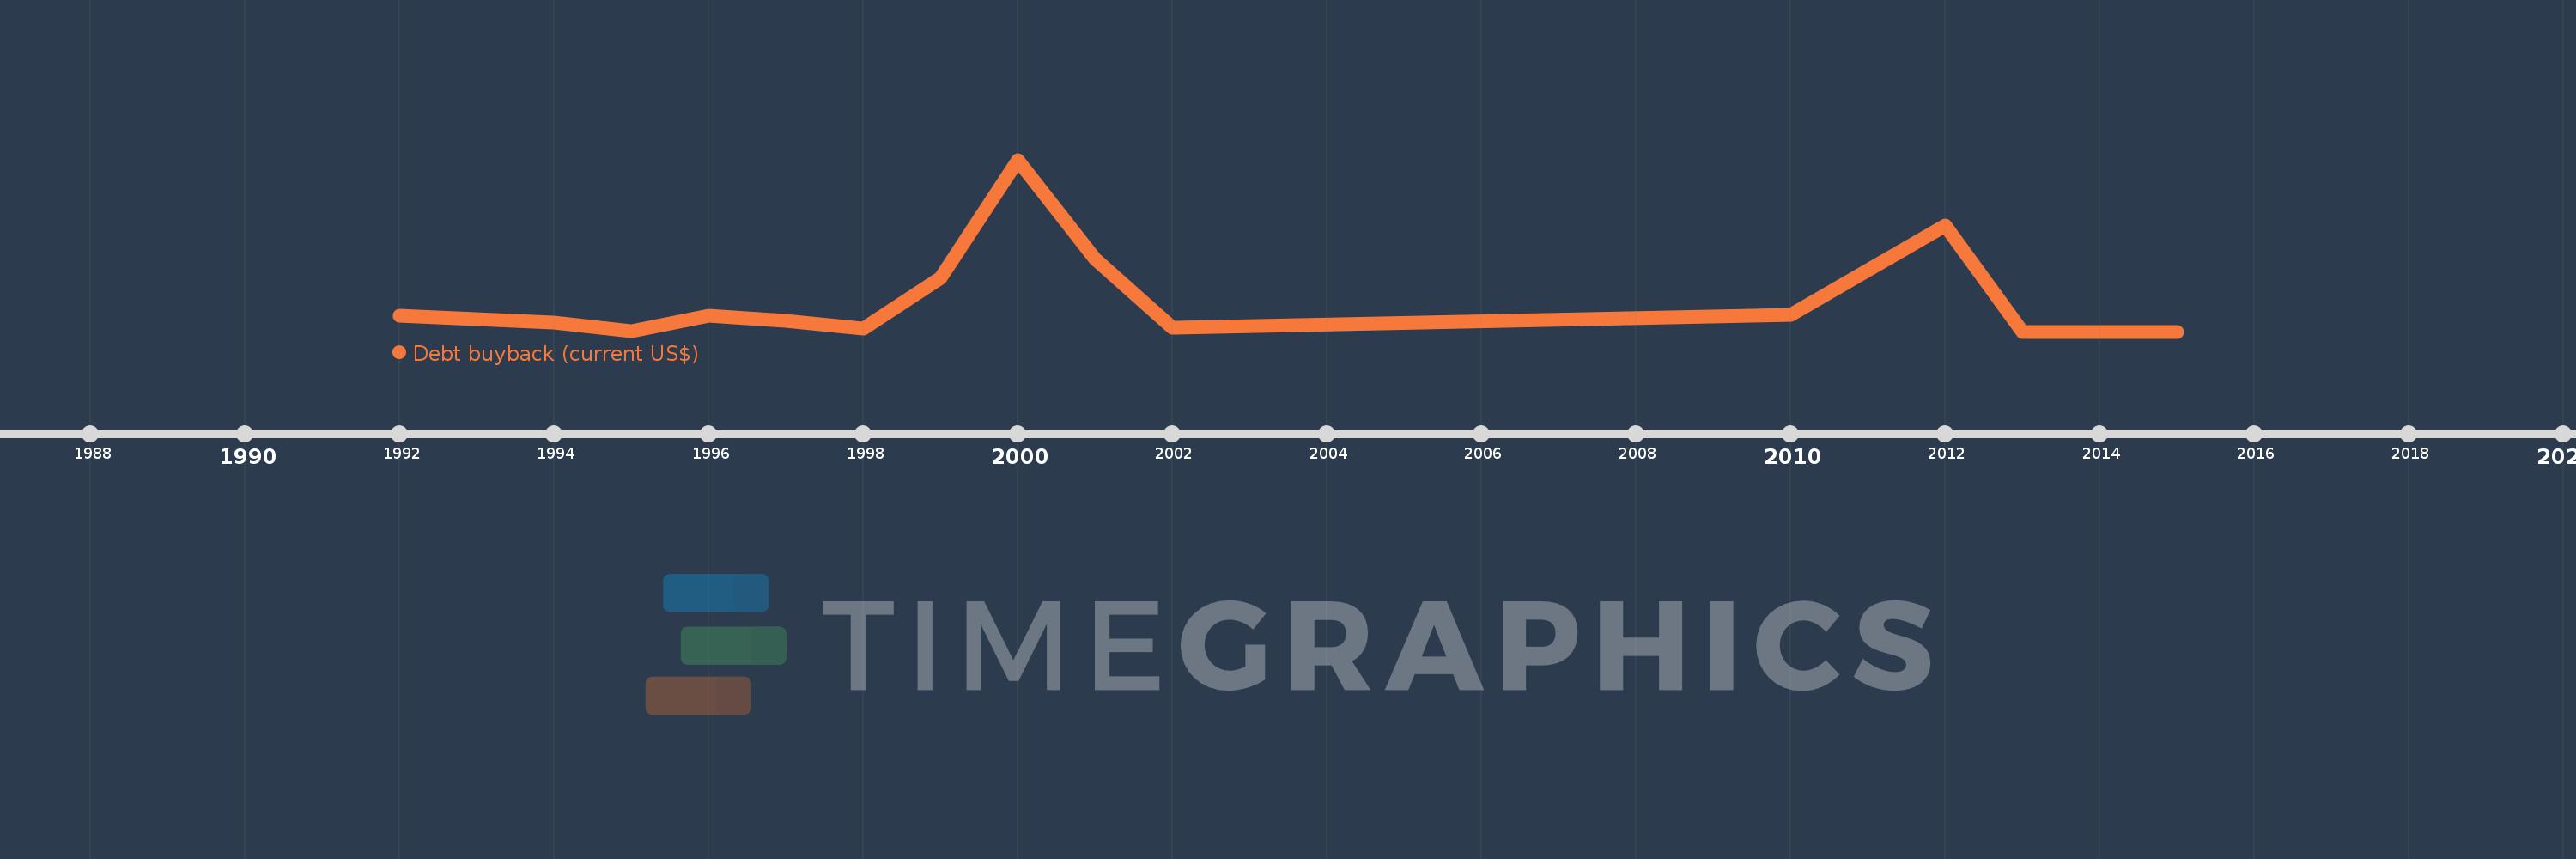
Debt buyback (current US$)
2015,2013,2012,2010,2002,2001,2000,1999,1998,1997,1996,1995,1994,1992
This statistics in other country:
Timeline:
This timeline shows a graph from 1992 to 2015 of Low income. No data until 1991. Number of actual observations by date: 14.
Source name:
World Development Indicators
Source organization:
World Bank, International Debt Statistics.
Categories, topics:
External Debt
Last updated:
apr 23, 2017
Indicators value changes by year
Maximum:
325.128 mln
jan 1, 2000
At the date of observation
Value
Absolute change
Change from previous value
jan 1, 1992
30.492 mln
+30.492 mln
0.0%
jan 1, 1994
17.324 mln
-13.168 mln
-43.19%
jan 1, 1995
10.0K
-17.314 mln
-99.94%
jan 1, 1996
29.431 mln
+29.421 mln
294.21K%
jan 1, 1997
21.017 mln
-8.414 mln
-28.59%
jan 1, 1998
6.065 mln
-14.952 mln
-71.14%
jan 1, 1999
101.68 mln
+95.615 mln
1.58K%
jan 1, 2000
325.128 mln
+223.448 mln
219.76%
jan 1, 2001
136.904 mln
-188.224 mln
-57.89%
jan 1, 2002
7.42 mln
-129.484 mln
-94.58%
jan 1, 2010
31.962 mln
+24.542 mln
330.75%
jan 1, 2012
200.0 mln
+168.038 mln
525.74%
jan 1, 2013
0.0
-200.0 mln
-100.0%
Ranking of countries by current statistics by years


Comments: