29
/
en
AIzaSyAYiBZKx7MnpbEhh9jyipgxe19OcubqV5w
April 1, 2024
46997
Lower middle income
LMC
false
2
1
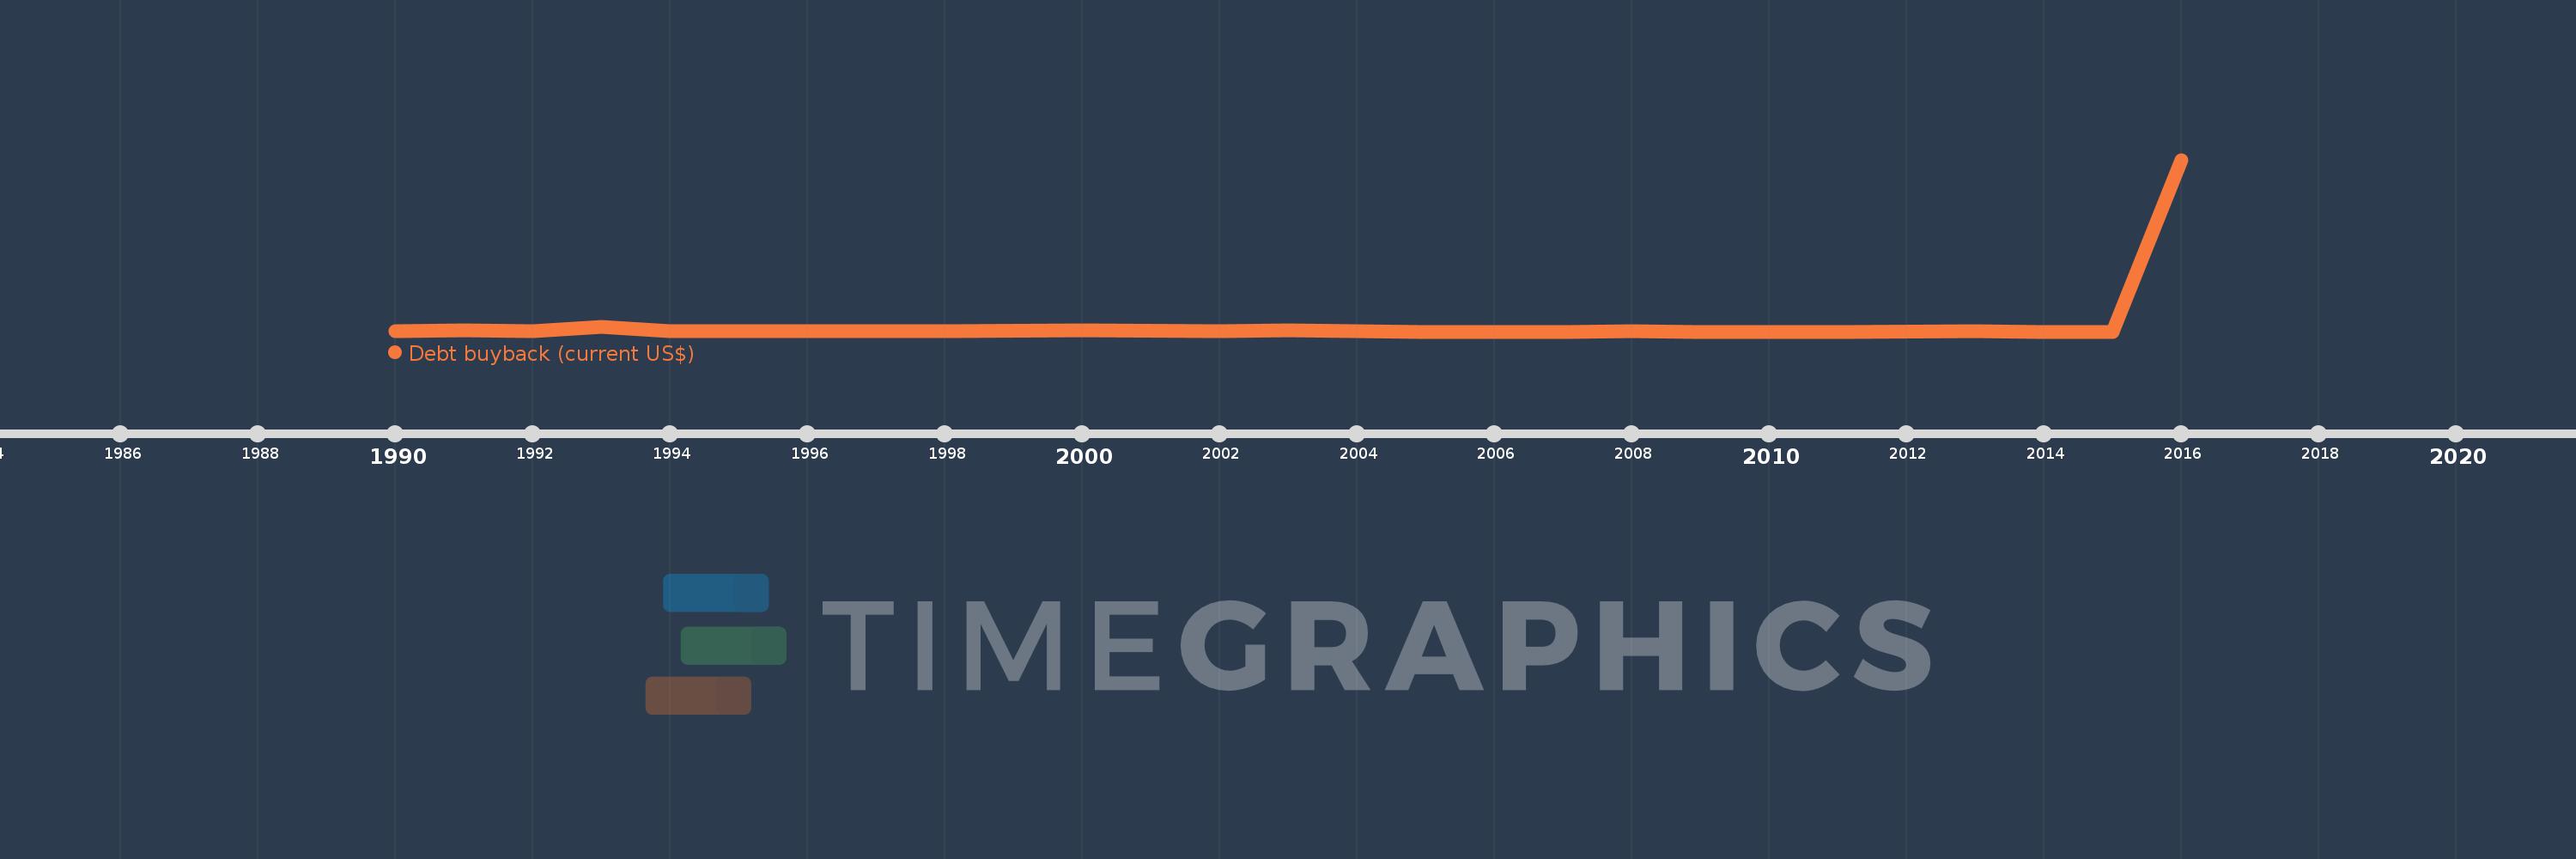
Debt buyback (current US$)
2016,2015,2014,2013,2011,2010,2009,2008,2007,2005,2004,2003,2002,2000,1998,1997,1996,1995,1994,1993,1992,1991,1990
This statistics in other country:
Timeline:
This timeline shows a graph from 1990 to 2016 of Lower middle income. No data until 1989. Number of actual observations by date: 23.
Source name:
World Development Indicators
Source organization:
World Bank, International Debt Statistics.
Categories, topics:
External Debt
Last updated:
apr 23, 2017
Indicators value changes by year
Maximum:
89.446 bln
jan 1, 2016
At the date of observation
Value
Absolute change
Change from previous value
jan 1, 1990
15.879 mln
+15.879 mln
0.0%
jan 1, 1991
724.363 mln
+708.484 mln
4.46K%
jan 1, 1992
254.991 mln
-469.372 mln
-64.8%
jan 1, 1993
2.511 bln
+2.256 bln
884.82%
jan 1, 1994
27.294 mln
-2.484 bln
-98.91%
jan 1, 1995
7.695 mln
-19.599 mln
-71.81%
jan 1, 1996
89.082 mln
+81.387 mln
1.06K%
jan 1, 1997
280.471 mln
+191.389 mln
214.85%
jan 1, 1998
193.776 mln
-86.695 mln
-30.91%
jan 1, 2000
858.833 mln
+665.057 mln
343.21%
jan 1, 2002
38.519 mln
-820.314 mln
-95.51%
jan 1, 2003
452.0 mln
+413.481 mln
1.07K%
jan 1, 2004
19.735 mln
-432.265 mln
-95.63%
jan 1, 2005
0.0
-19.735 mln
-100.0%
jan 1, 2008
16.537 mln
+16.537 mln
%
jan 1, 2009
0.0
-16.537 mln
-100.0%
jan 1, 2013
230.0 mln
+230.0 mln
%
jan 1, 2014
0.0
-230.0 mln
-100.0%
jan 1, 2016
89.446 bln
+89.446 bln
%
Ranking of countries by current statistics by years


Comments: