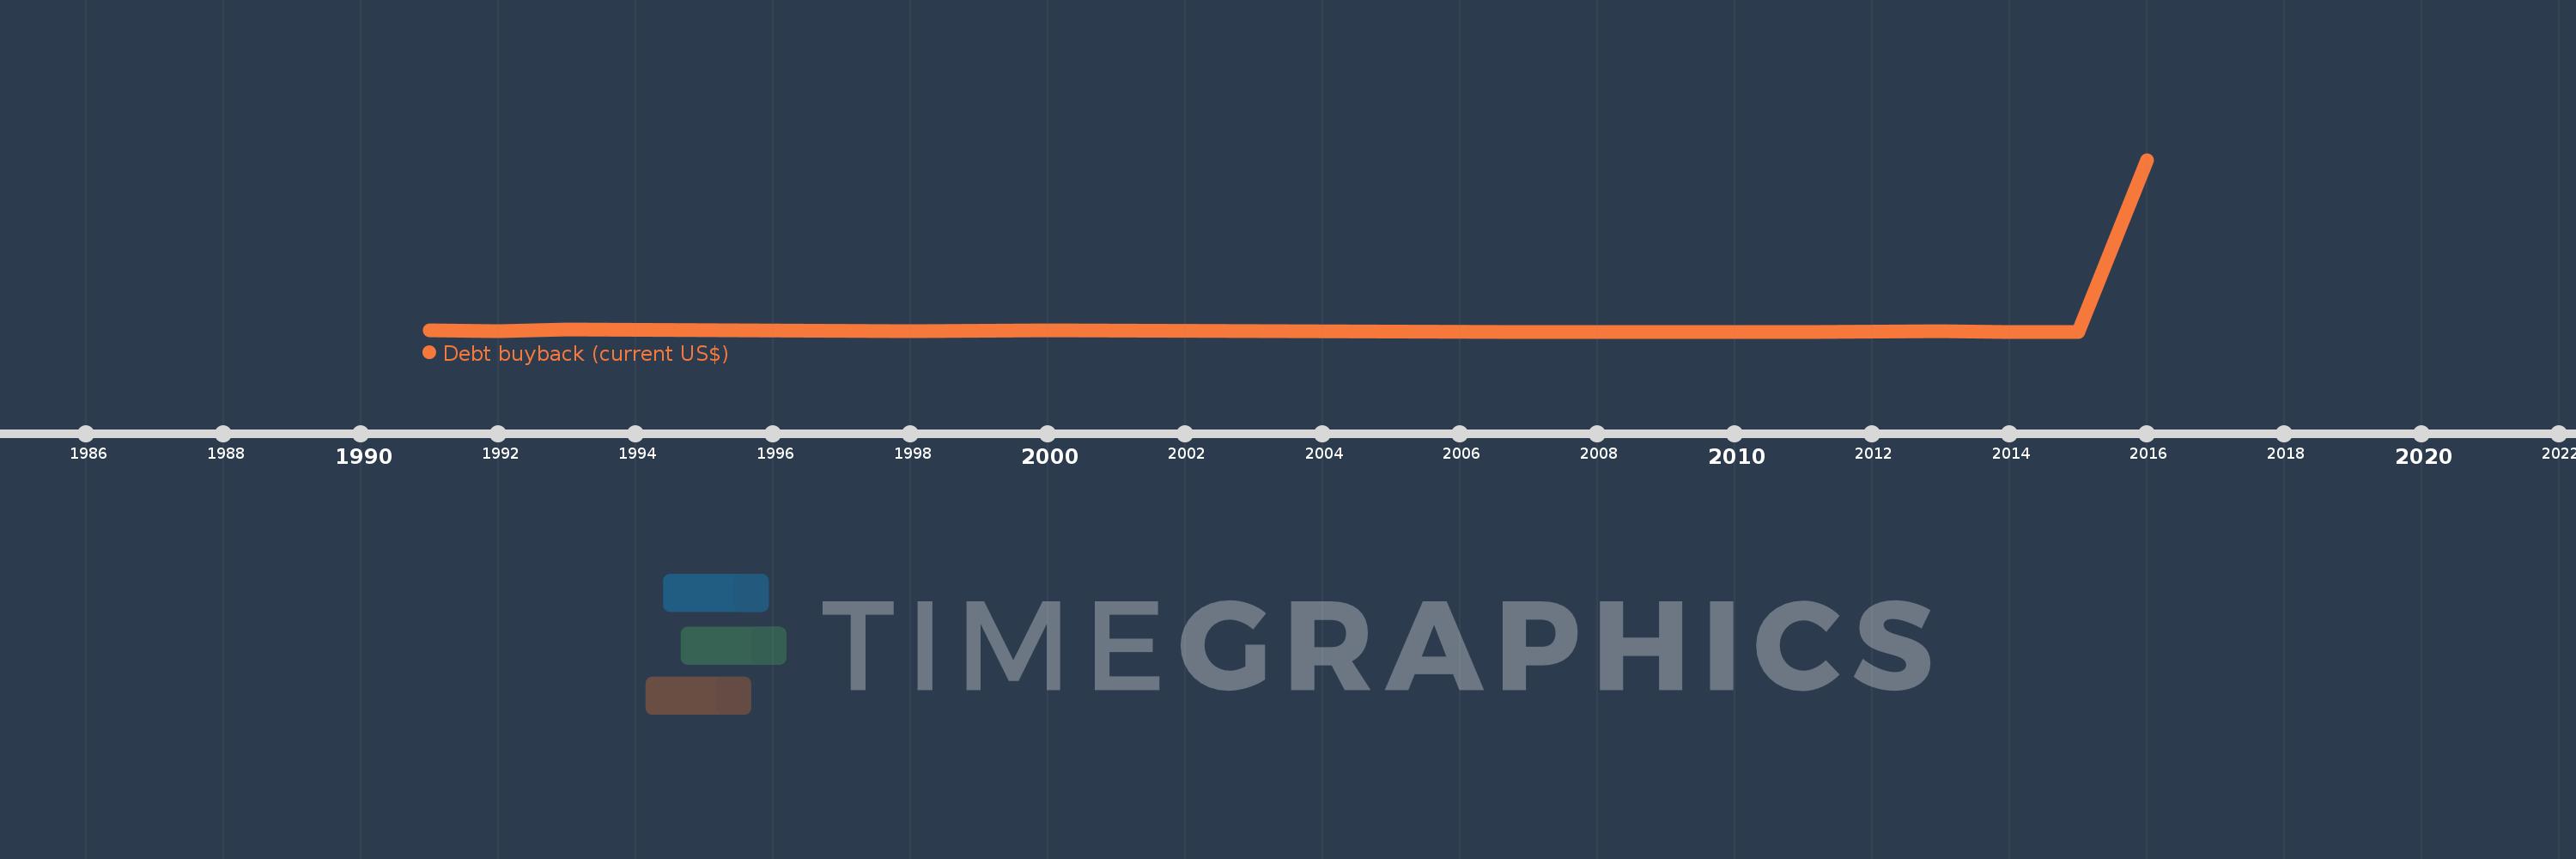
This timeline shows a graph from 1991 to 2016 of East Asia & Pacific (excluding high income). No data until 1990. Number of actual observations by date: 14.
Source name:
World Development Indicators
Source organization:
World Bank, International Debt Statistics.
Categories, topics:
External Debt
Last updated:
apr 23, 2017
Indicators value changes by year
Meaning:
6.611 bln
Minimum:
0.0
jan 1, 2007
Maximum:
89.446 bln
jan 1, 2016
At the date of observation
Value
Absolute change
Change from the previous value
jan 1, 1991
720.671 mln
+720.671 mln
0.0%
jan 1, 1992
93.605 mln
-627.066 mln
-87.01%
jan 1, 1993
1.175 bln
+1.081 bln
1.15K%
jan 1, 1998
30.776 mln
-1.144 bln
-97.38%
jan 1, 2000
858.828 mln
+828.052 mln
2.69K%
jan 1, 2007
0.0
-858.828 mln
-100.0%
jan 1, 2008
0.0
0.0
%
jan 1, 2009
0.0
0.0
%
jan 1, 2010
0.0
0.0
%
jan 1, 2011
0.0
0.0
%
jan 1, 2013
230.0 mln
+230.0 mln
%
jan 1, 2014
0.0
-230.0 mln
-100.0%
jan 1, 2015
0.0
0.0
%
jan 1, 2016
89.446 bln
+89.446 bln
%
Ranking of countries by current statistics by years
