29
/
en
AIzaSyAYiBZKx7MnpbEhh9jyipgxe19OcubqV5w
April 1, 2024
45491
Low & middle income
LMY
false
2
1
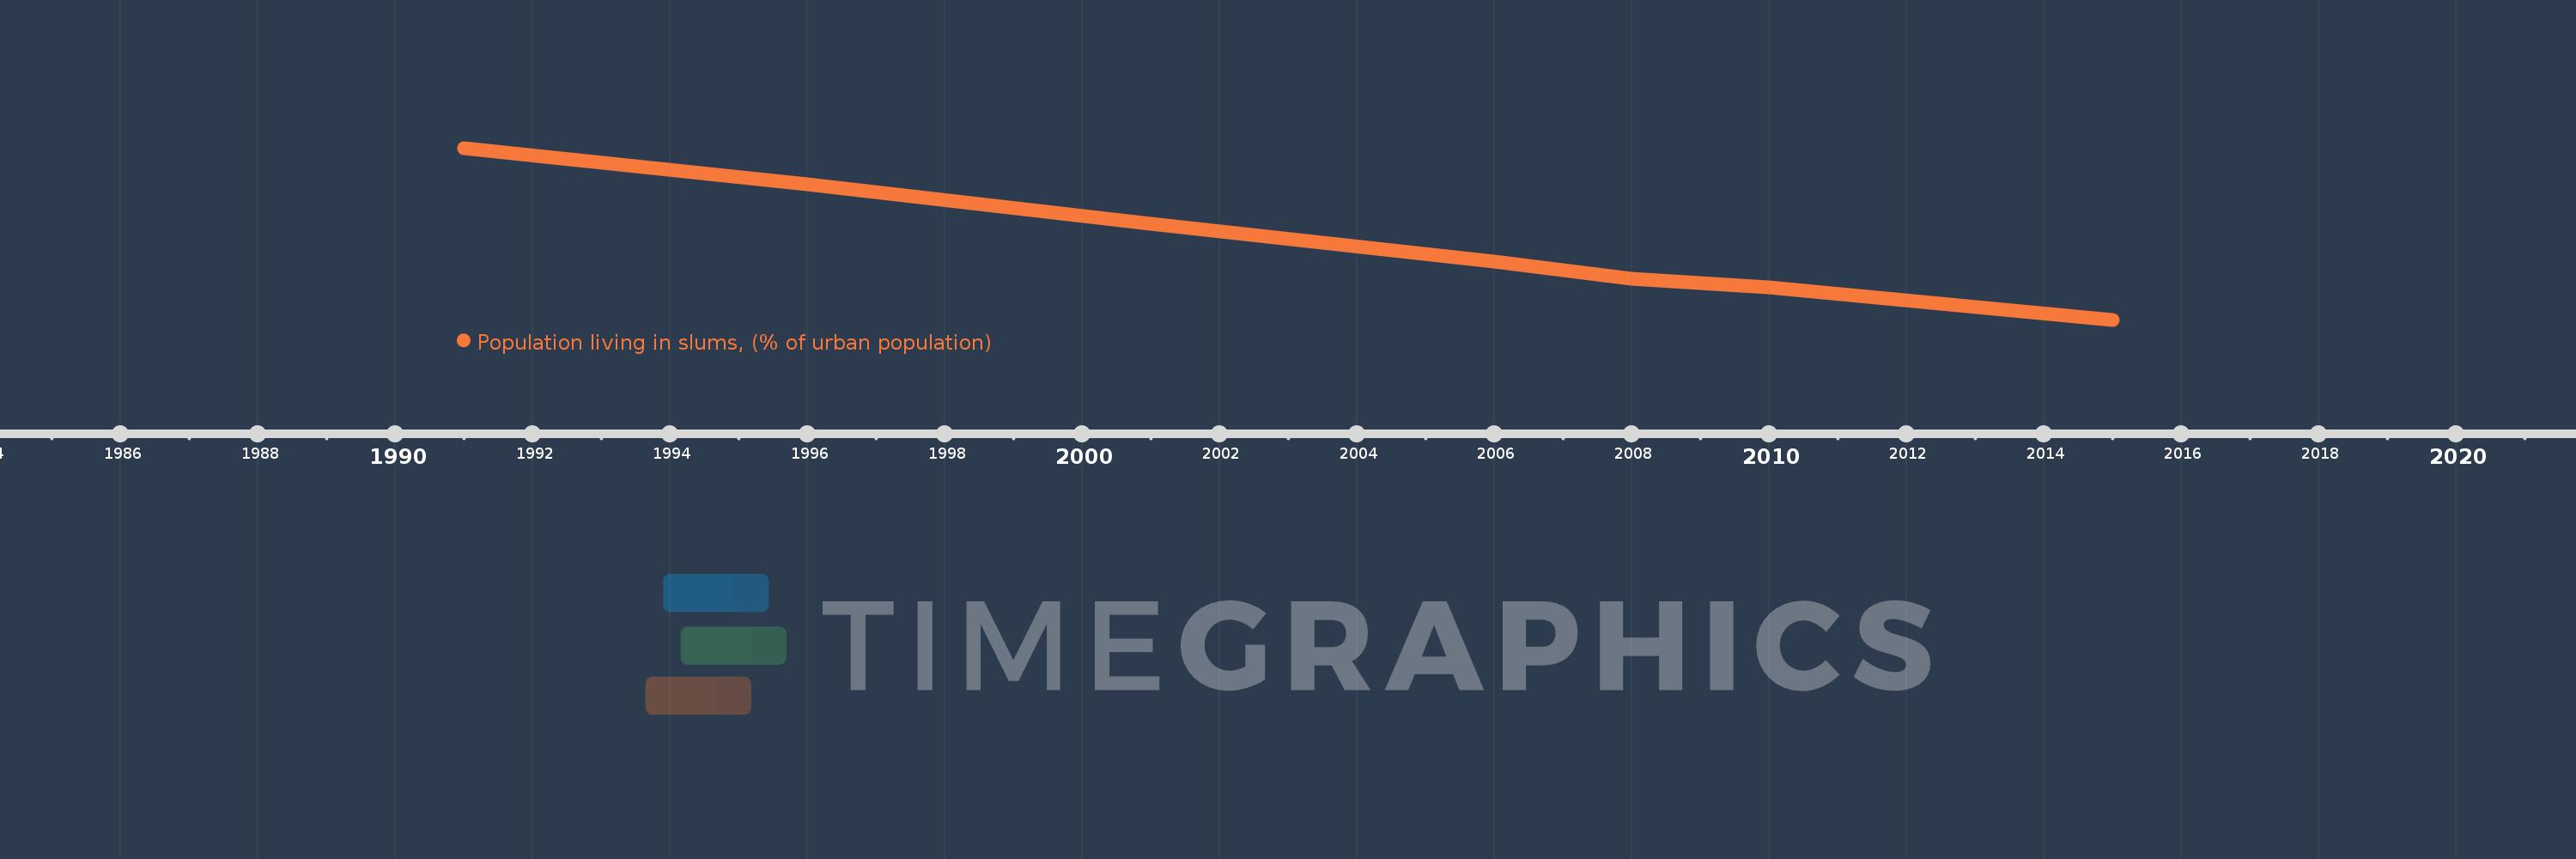
Population living in slums, (% of urban population)
2015,2010,2008,2006,2001,1996,1991
This statistics in other country:
Timeline:
This timeline shows a graph from 1991 to 2015 of Low & middle income. No data until 1990. Number of actual observations by date: 7.
Source name:
World Development Indicators
Source organization:
UN HABITAT, retrieved from the United Nation's Millennium Development Goals database. Data are available at: Http://mdgs.un.org
Categories, topics:
Poverty, Urban Development, Environment
Last updated:
apr 23, 2017
Indicators value changes by year
Minimum:
29.719
jan 1, 2015
Maximum:
47.236
jan 1, 1991
At the date of observation
Value
Absolute change
Change from previous value
jan 1, 1991
47.236
+47.236
0.0%
jan 1, 1996
43.51
-3.726
-7.89%
jan 1, 2001
39.534
-3.977
-9.14%
jan 1, 2006
35.611
-3.923
-9.92%
jan 1, 2008
33.937
-1.674
-4.7%
jan 1, 2010
33.03
-0.907
-2.67%
jan 1, 2015
29.719
-3.312
-10.03%
Ranking of countries by current statistics by years


Comments: