29
/
en
AIzaSyAYiBZKx7MnpbEhh9jyipgxe19OcubqV5w
April 1, 2024
144898
Guatemala
GTM
true
2
1
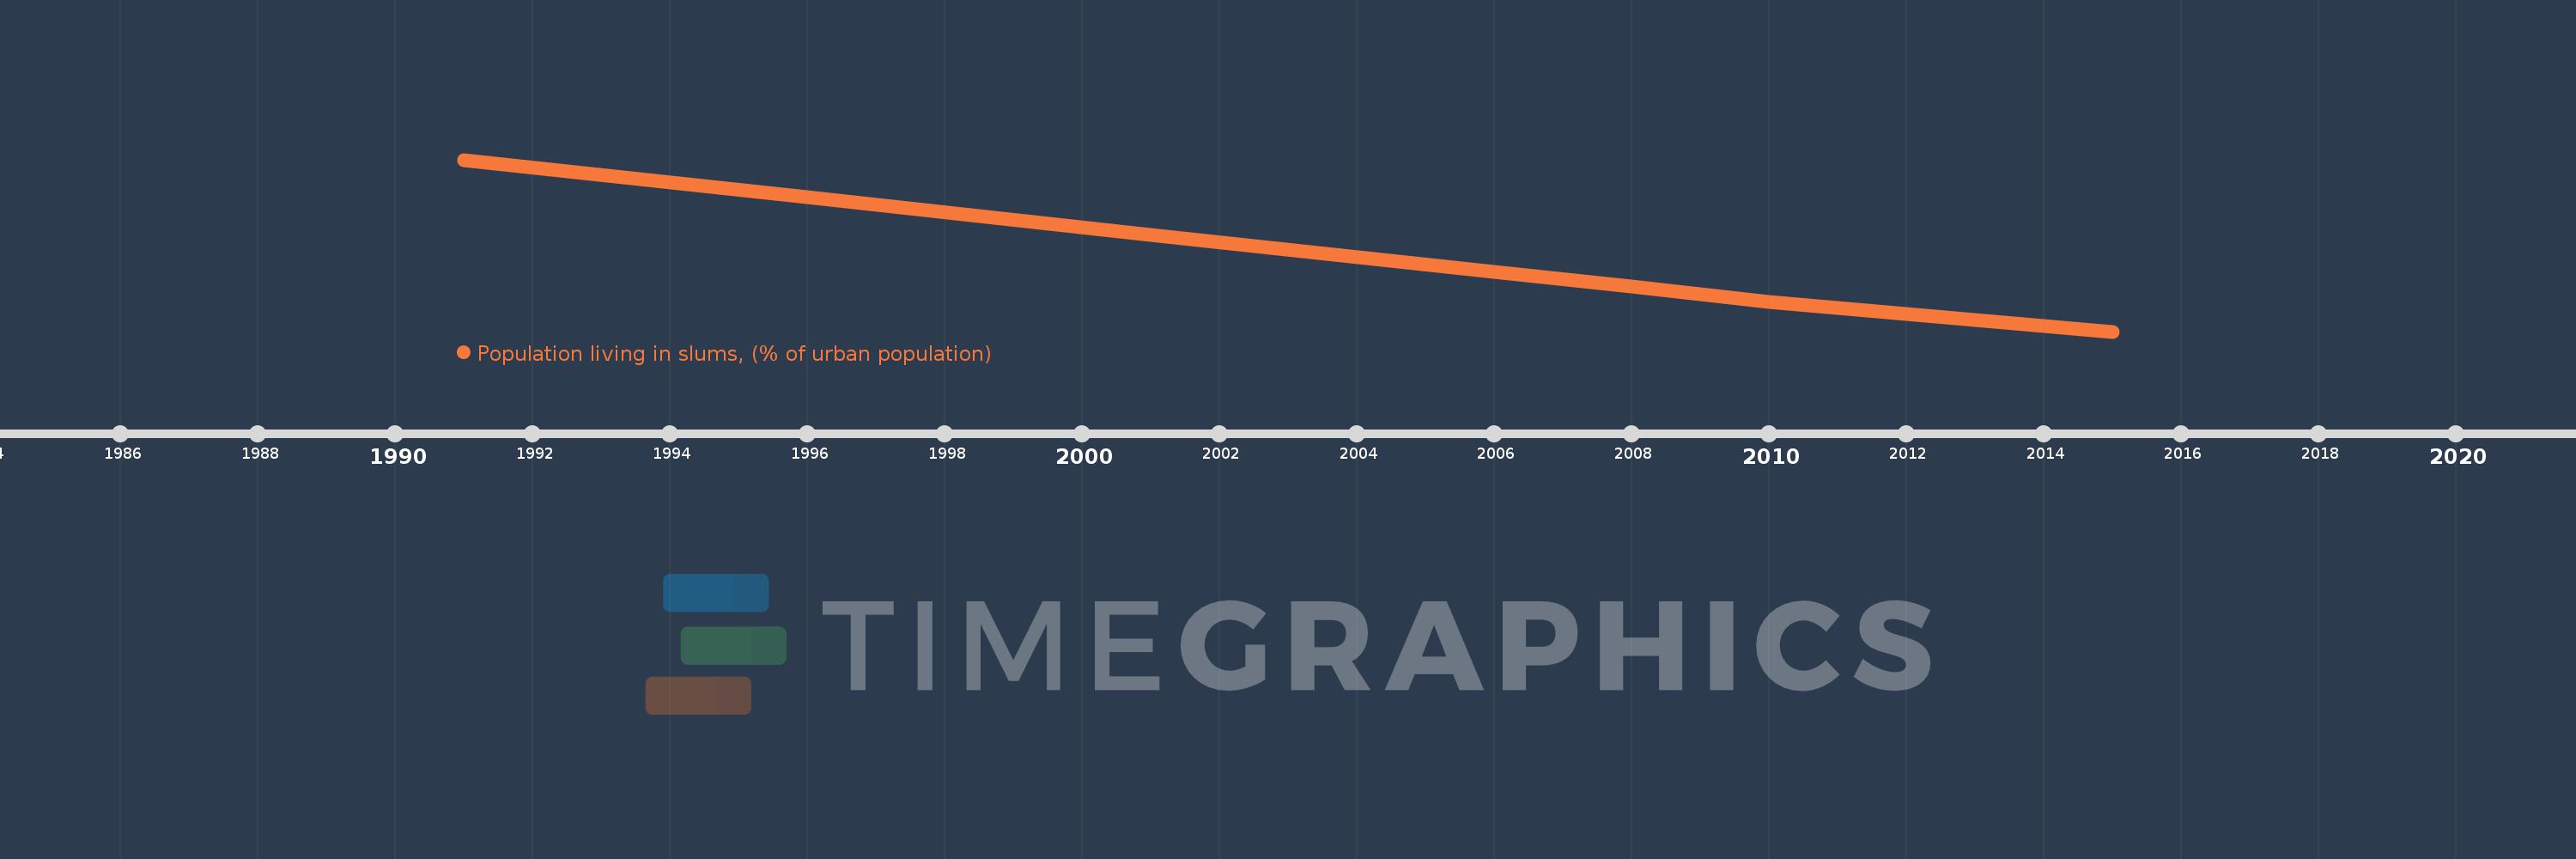
Population living in slums, (% of urban population)
2015,2010,2008,2006,2001,1996,1991
This statistics in other country:
Timeline:
This timeline shows a graph from 1991 to 2015 of Guatemala. No data until 1990. Number of actual observations by date: 7.
Source name:
World Development Indicators
Source organization:
UN HABITAT, retrieved from the United Nation's Millennium Development Goals database. Data are available at: Http://mdgs.un.org
Categories, topics:
Poverty, Urban Development, Environment
Last updated:
apr 23, 2017
Indicators value changes by year
At the date of observation
Value
Absolute change
Change from previous value
jan 1, 1991
58.6
+58.6
0.0%
jan 1, 1996
53.3
-5.3
-9.04%
jan 1, 2001
48.1
-5.2
-9.76%
jan 1, 2006
42.9
-5.2
-10.81%
jan 1, 2008
40.8
-2.1
-4.9%
jan 1, 2010
38.7
-2.1
-5.15%
jan 1, 2015
34.5
-4.2
-10.85%
Ranking of countries by current statistics by years


Comments: