29
/
en
AIzaSyAYiBZKx7MnpbEhh9jyipgxe19OcubqV5w
April 1, 2024
41822
Latin America & Caribbean
LCN
false
2
1
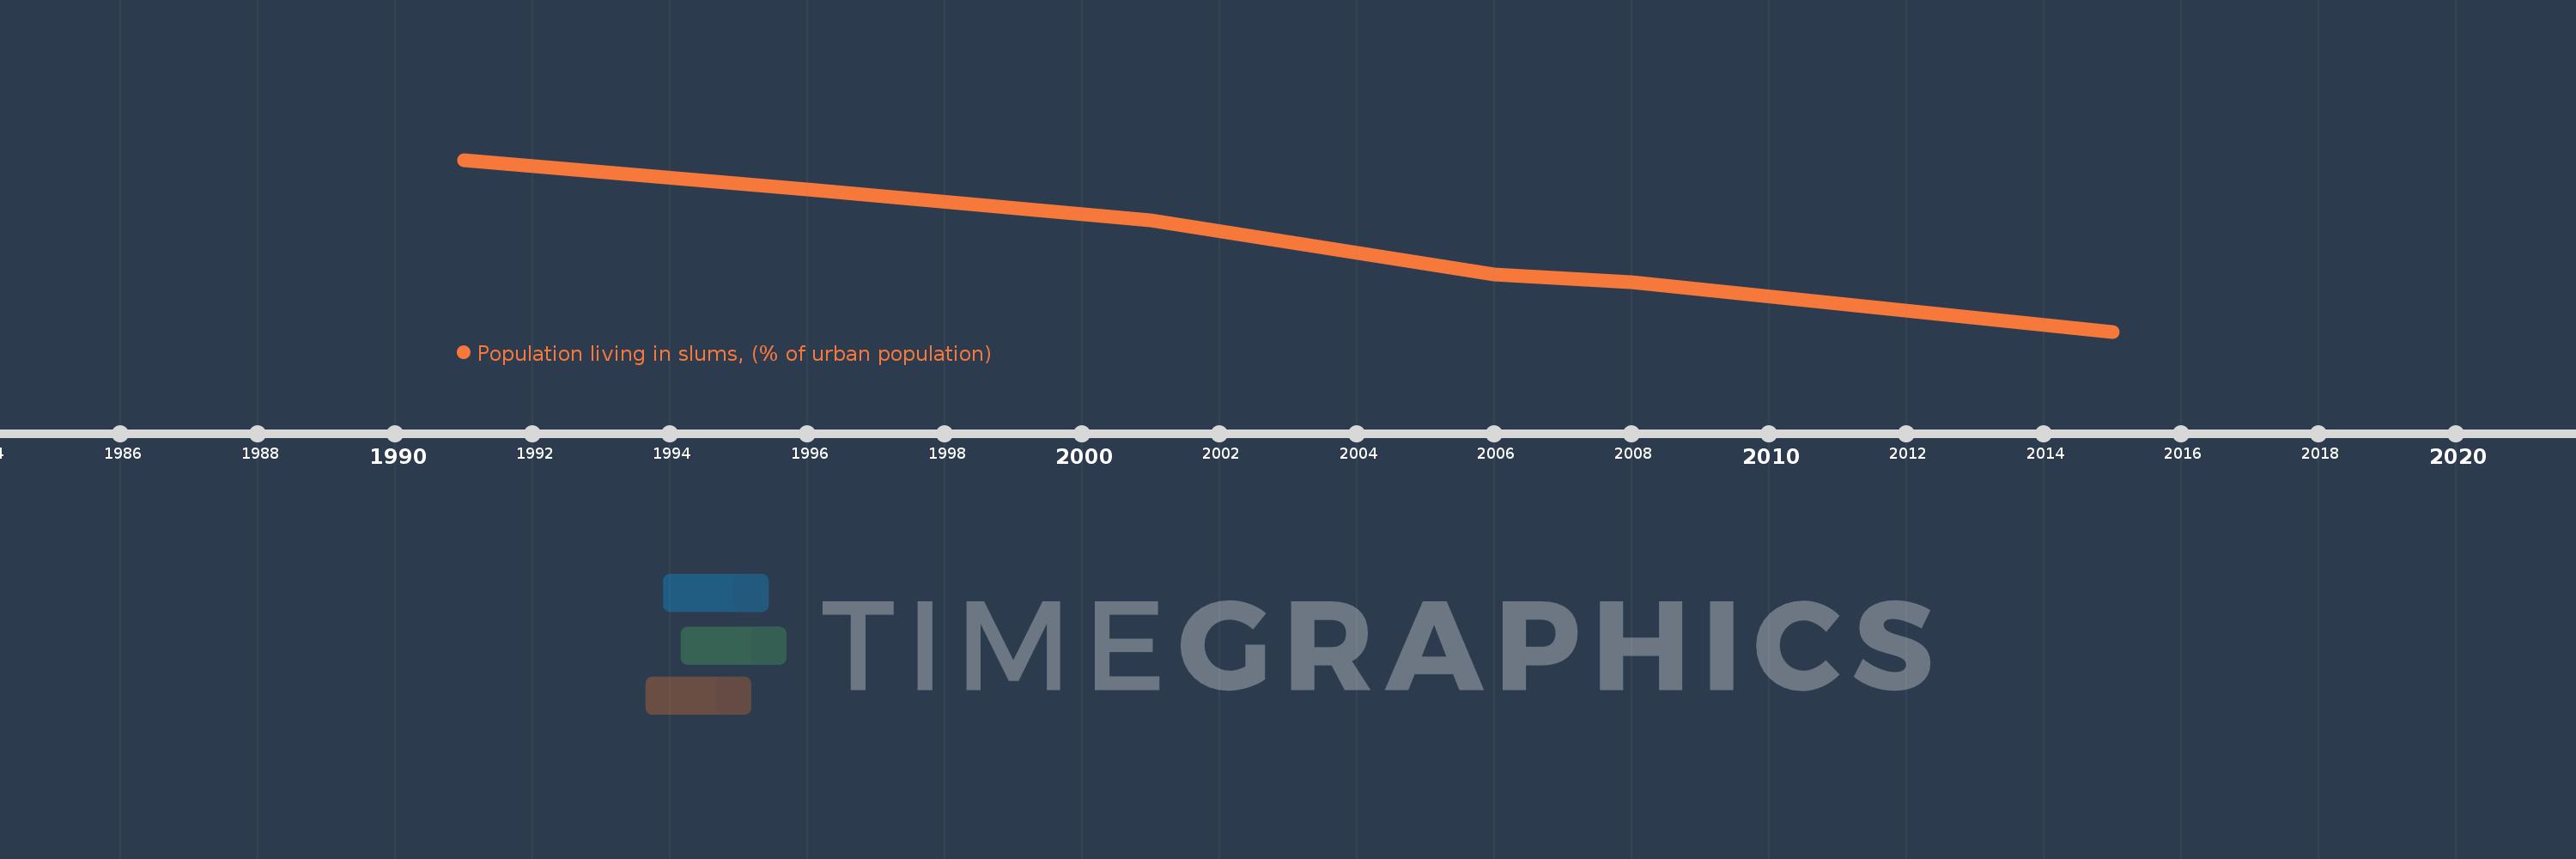
Population living in slums, (% of urban population)
2015,2008,2006,2001,1996,1991
This statistics in other country:
Timeline:
This timeline shows a graph from 1991 to 2015 of Latin America & Caribbean . No data until 1990. Number of actual observations by date: 6.
Source name:
World Development Indicators
Source organization:
UN HABITAT, retrieved from the United Nation's Millennium Development Goals database. Data are available at: Http://mdgs.un.org
Categories, topics:
Poverty, Urban Development, Environment
Last updated:
apr 23, 2017
Indicators value changes by year
Minimum:
20.456
jan 1, 2015
Maximum:
35.451
jan 1, 1991
At the date of observation
Value
Absolute change
Change from previous value
jan 1, 1991
35.451
+35.451
0.0%
jan 1, 1996
32.851
-2.6
-7.33%
jan 1, 2001
30.202
-2.649
-8.06%
jan 1, 2006
25.422
-4.78
-15.83%
jan 1, 2008
24.761
-0.661
-2.6%
jan 1, 2015
20.456
-4.305
-17.39%
Ranking of countries by current statistics by years


Comments: