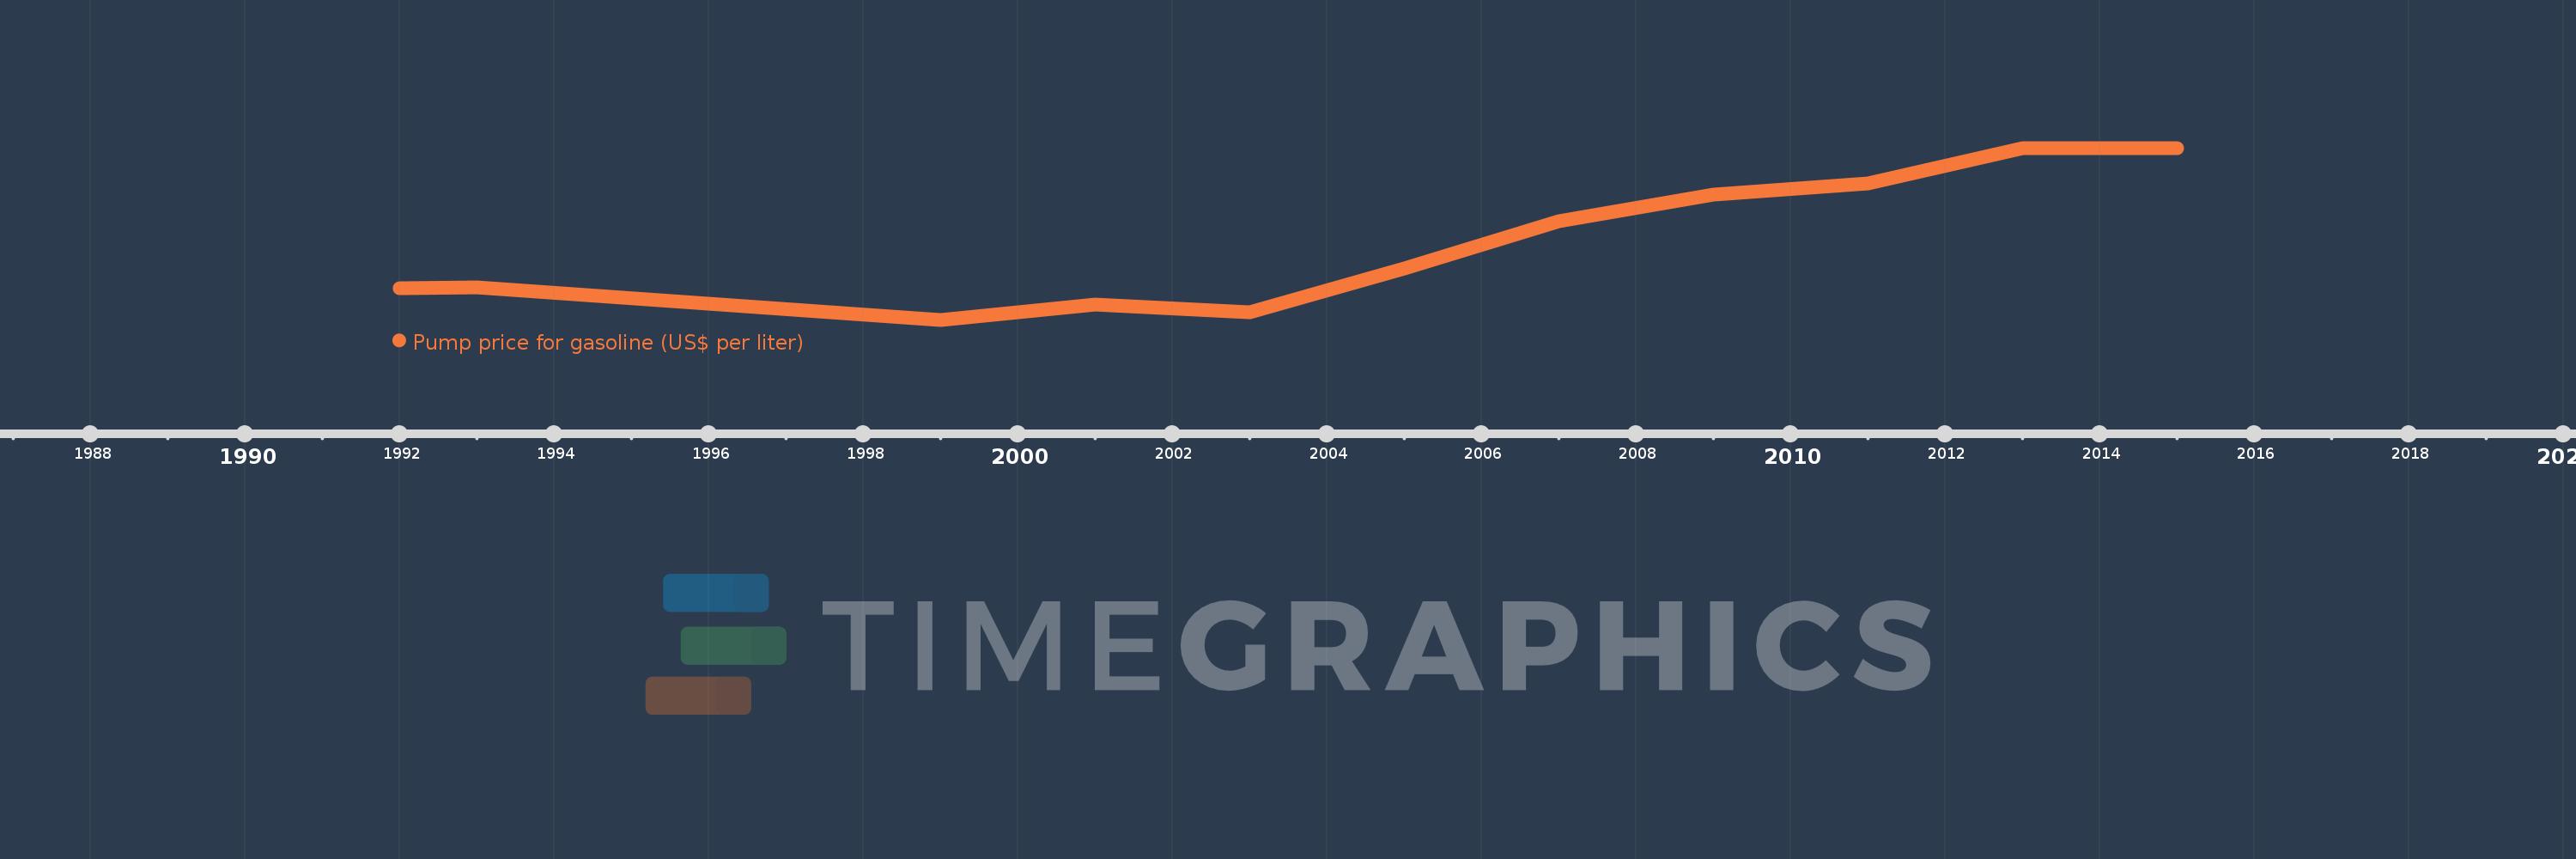
This timeline shows a graph from 1992 to 2015 of Least developed countries: UN classification. No data until 1991. Number of actual observations by date: 11.
Source name:
World Development Indicators
Source organization:
German Agency for International Cooperation (GIZ).
Categories, topics:
Energy & Mining, Urban Development
Last updated:
apr 23, 2017
Indicators value changes by year
Meaning:
0.913
Minimum:
0.57
jan 1, 1999
Maximum:
1.34
jan 1, 2013
At the date of observation
Value
Absolute change
Change from the previous value
jan 1, 1992
0.71
+0.71
0.0%
jan 1, 1993
0.715
+0.005
0.7%
jan 1, 1999
0.57
-0.145
-20.28%
jan 1, 2001
0.64
+0.07
12.28%
jan 1, 2003
0.605
-0.035
-5.47%
jan 1, 2005
0.8
+0.195
32.23%
jan 1, 2007
1.01
+0.21
26.25%
jan 1, 2009
1.13
+0.12
11.88%
jan 1, 2011
1.18
+0.05
4.42%
jan 1, 2013
1.34
+0.16
13.56%
jan 1, 2015
1.34
0.0
0.0%
Ranking of countries by current statistics by years
