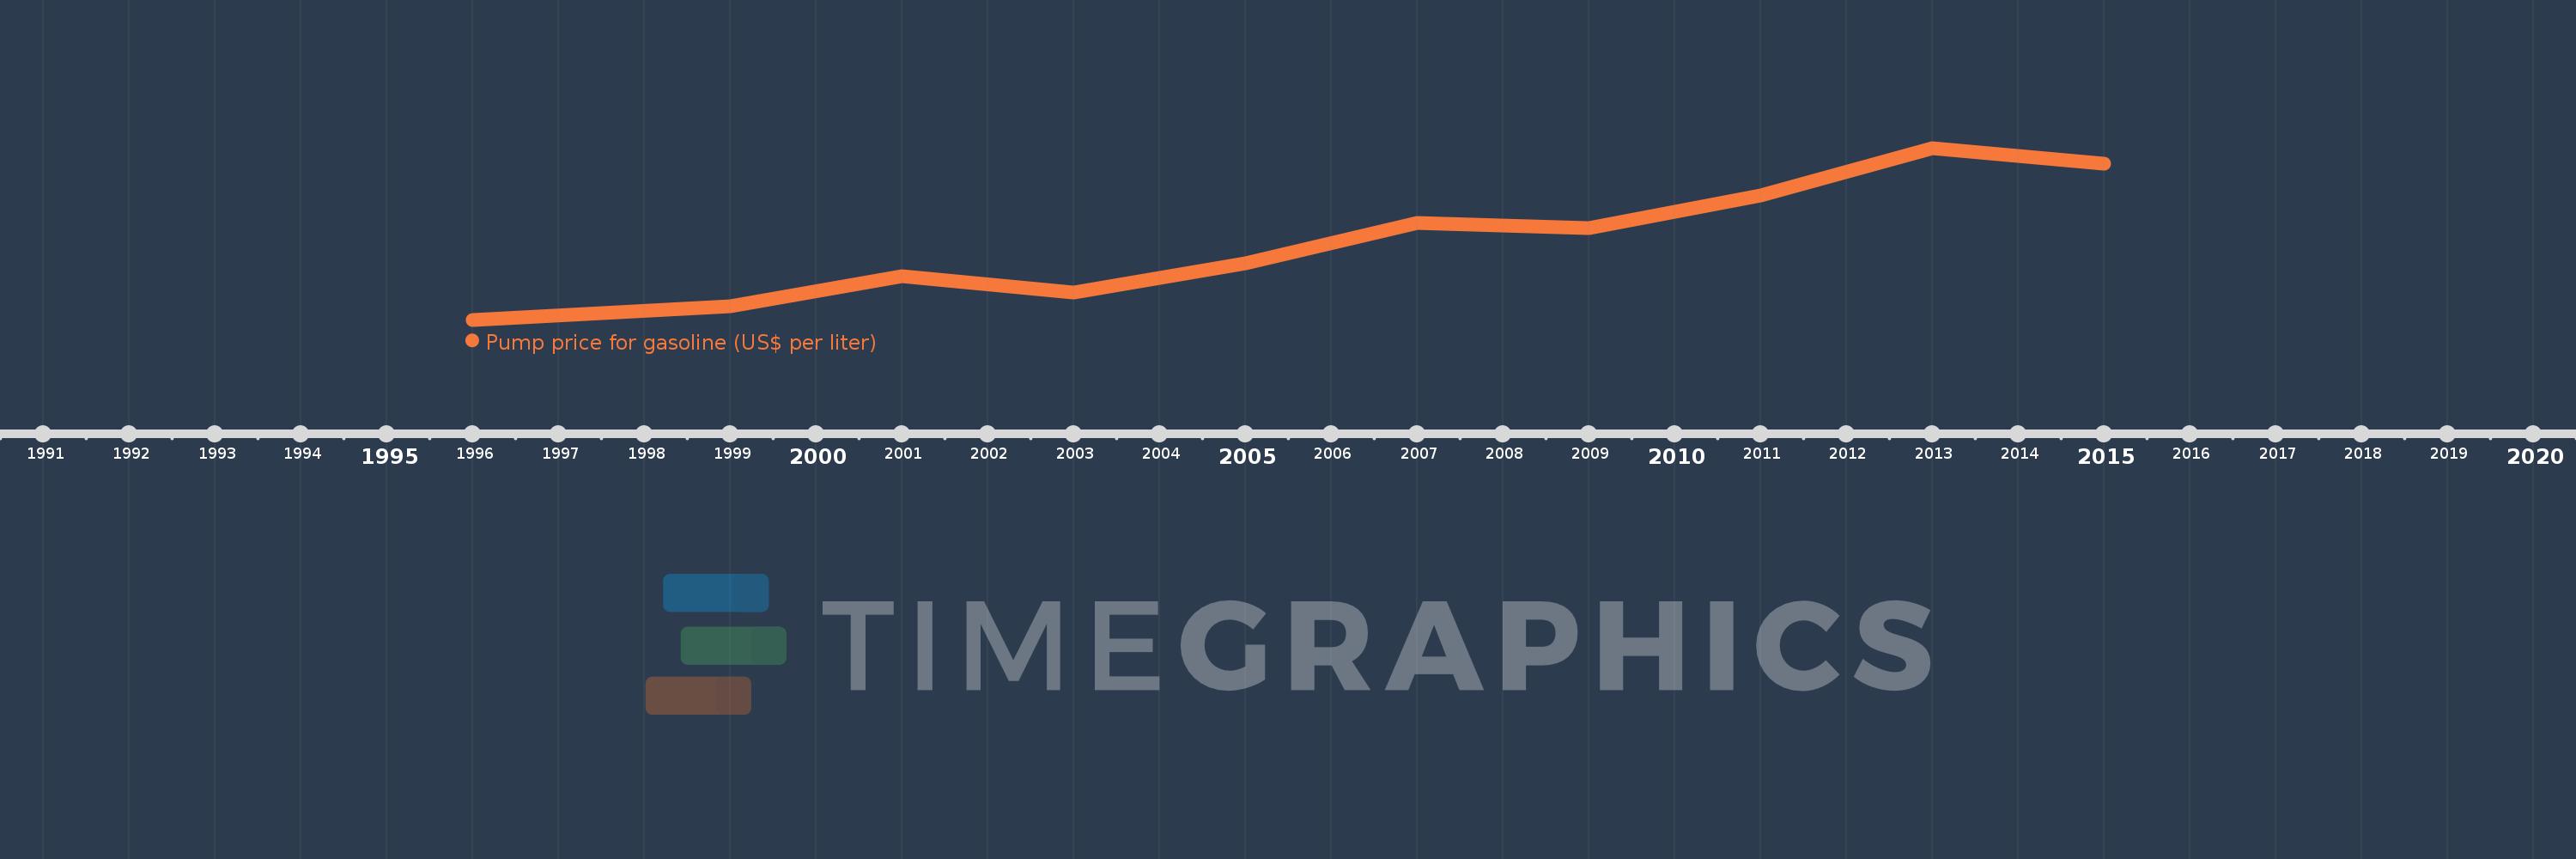
This timeline shows a graph from 1996 to 2015 of Latin America & the Caribbean (IDA & IBRD countries). No data until 1995. Number of actual observations by date: 10.
Source name:
World Development Indicators
Source organization:
German Agency for International Cooperation (GIZ).
Categories, topics:
Energy & Mining, Urban Development
Last updated:
apr 23, 2017
Indicators value changes by year
Meaning:
0.796
Minimum:
0.4
jan 1, 1996
Maximum:
1.27
jan 1, 2013
At the date of observation
Value
Absolute change
Change from the previous value
jan 1, 1996
0.4
+0.4
0.0%
jan 1, 1999
0.47
+0.07
17.5%
jan 1, 2001
0.62
+0.15
31.91%
jan 1, 2003
0.54
-0.08
-12.9%
jan 1, 2005
0.685
+0.145
26.85%
jan 1, 2007
0.89
+0.205
29.93%
jan 1, 2009
0.865
-0.025
-2.81%
jan 1, 2011
1.03
+0.165
19.08%
jan 1, 2013
1.27
+0.24
23.3%
jan 1, 2015
1.19
-0.08
-6.3%
Ranking of countries by current statistics by years
