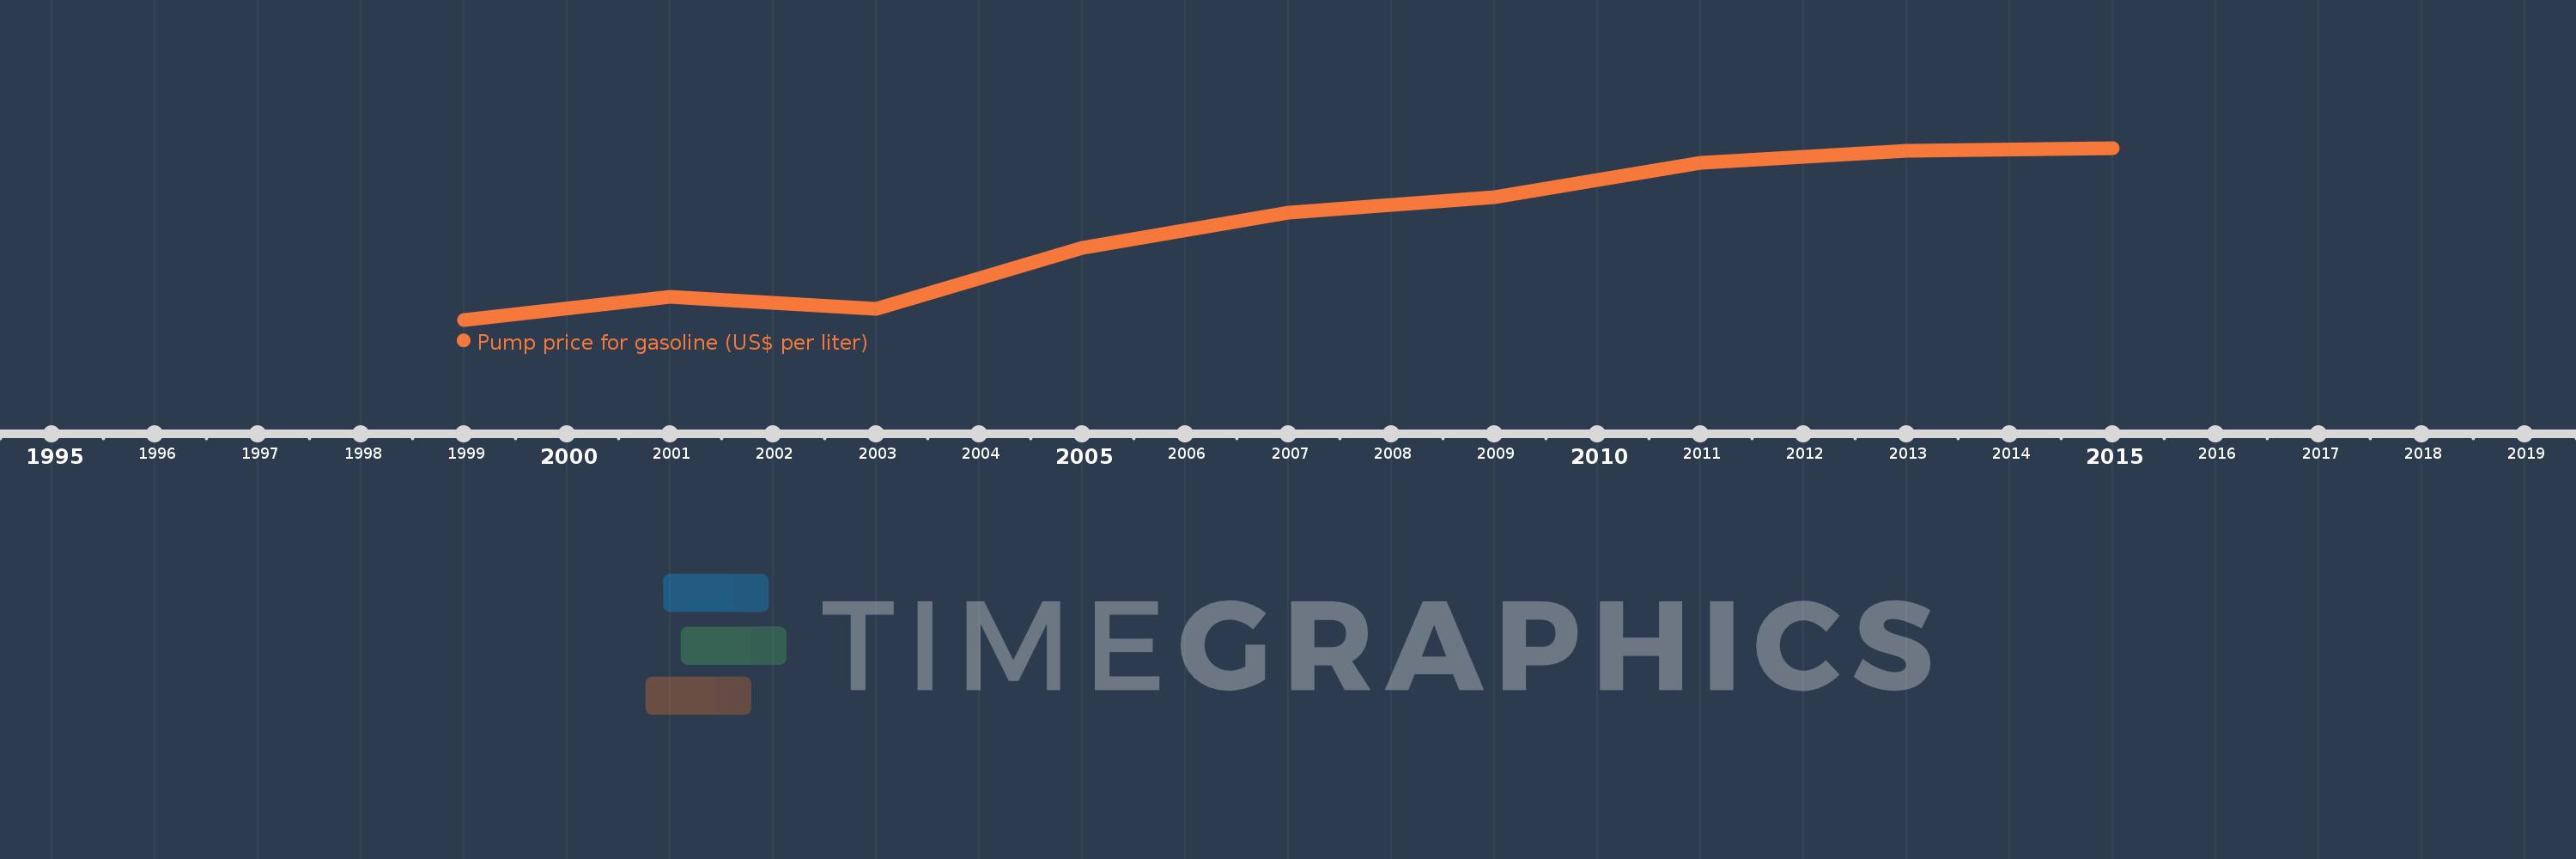
This timeline shows a graph from 1999 to 2015 of Fragile and conflict affected situations. No data until 1998. Number of actual observations by date: 9.
Source name:
World Development Indicators
Source organization:
German Agency for International Cooperation (GIZ).
Categories, topics:
Energy & Mining, Urban Development
Last updated:
apr 23, 2017
Indicators value changes by year
Meaning:
0.956
Minimum:
0.485
jan 1, 1999
Maximum:
1.36
jan 1, 2015
At the date of observation
Value
Absolute change
Change from the previous value
jan 1, 1999
0.485
+0.485
0.0%
jan 1, 2001
0.6
+0.115
23.71%
jan 1, 2003
0.54
-0.06
-10.0%
jan 1, 2005
0.85
+0.31
57.41%
jan 1, 2007
1.03
+0.18
21.18%
jan 1, 2009
1.11
+0.08
7.77%
jan 1, 2011
1.285
+0.175
15.77%
jan 1, 2013
1.345
+0.06
4.67%
jan 1, 2015
1.36
+0.015
1.12%
Ranking of countries by current statistics by years
