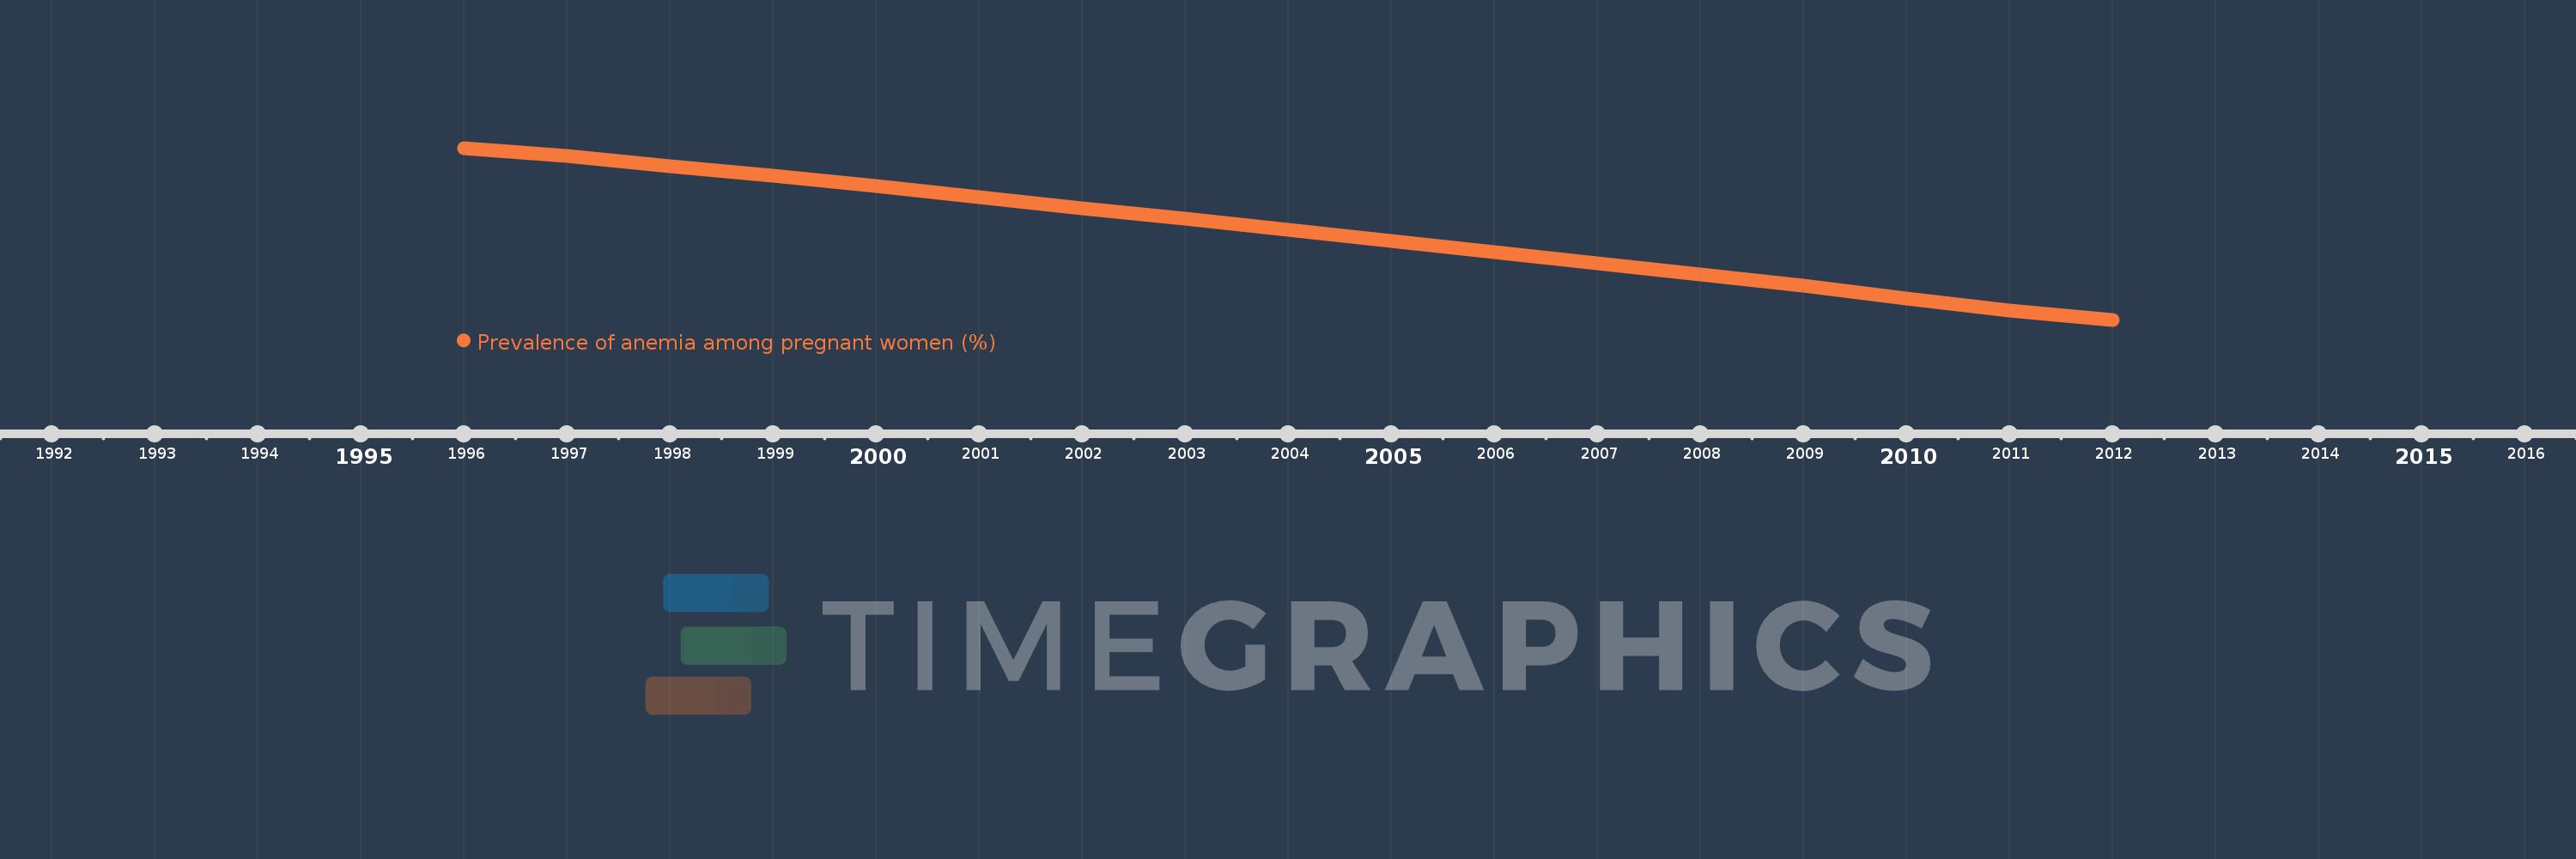
This timeline shows a graph from 1996 to 2012 of Latin America & Caribbean . No data until 1995. Number of actual observations by date: 17.
Source name:
World Development Indicators
Source organization:
1. WHO. Global anemia prevalence and trends 1995-2011. Geneva: World Health Organization; forthcoming. 2. Stevens GA, Finucane MM, De-Regil LM, et al. Global, regional, and national trends in hemoglobin concentration and prevalence of total and severe anemia in children and pregnant and non-pregnant women for 1995-2011: a systematic analysis of population-representative data. The Lancet Global Health 2013; 1(1): e16-e25.
Categories, topics:
Health
Last updated:
apr 23, 2017
Indicators value changes by year
Meaning:
32.766
Minimum:
28.231
jan 1, 2012
Maximum:
37.034
jan 1, 1996
At the date of observation
Value
Absolute change
Change from the previous value
jan 1, 1996
37.034
+37.034
0.0%
jan 1, 1997
36.612
-0.422
-1.14%
jan 1, 1998
36.101
-0.511
-1.4%
jan 1, 1999
35.602
-0.499
-1.38%
jan 1, 2000
35.085
-0.517
-1.45%
jan 1, 2001
34.506
-0.58
-1.65%
jan 1, 2002
33.942
-0.563
-1.63%
jan 1, 2003
33.404
-0.538
-1.59%
jan 1, 2004
32.847
-0.557
-1.67%
jan 1, 2005
32.271
-0.576
-1.75%
jan 1, 2006
31.707
-0.565
-1.75%
jan 1, 2007
31.13
-0.576
-1.82%
jan 1, 2008
30.55
-0.58
-1.86%
jan 1, 2009
29.957
-0.593
-1.94%
jan 1, 2010
29.329
-0.628
-2.1%
jan 1, 2011
28.713
-0.616
-2.1%
jan 1, 2012
28.231
-0.482
-1.68%
Ranking of countries by current statistics by years
