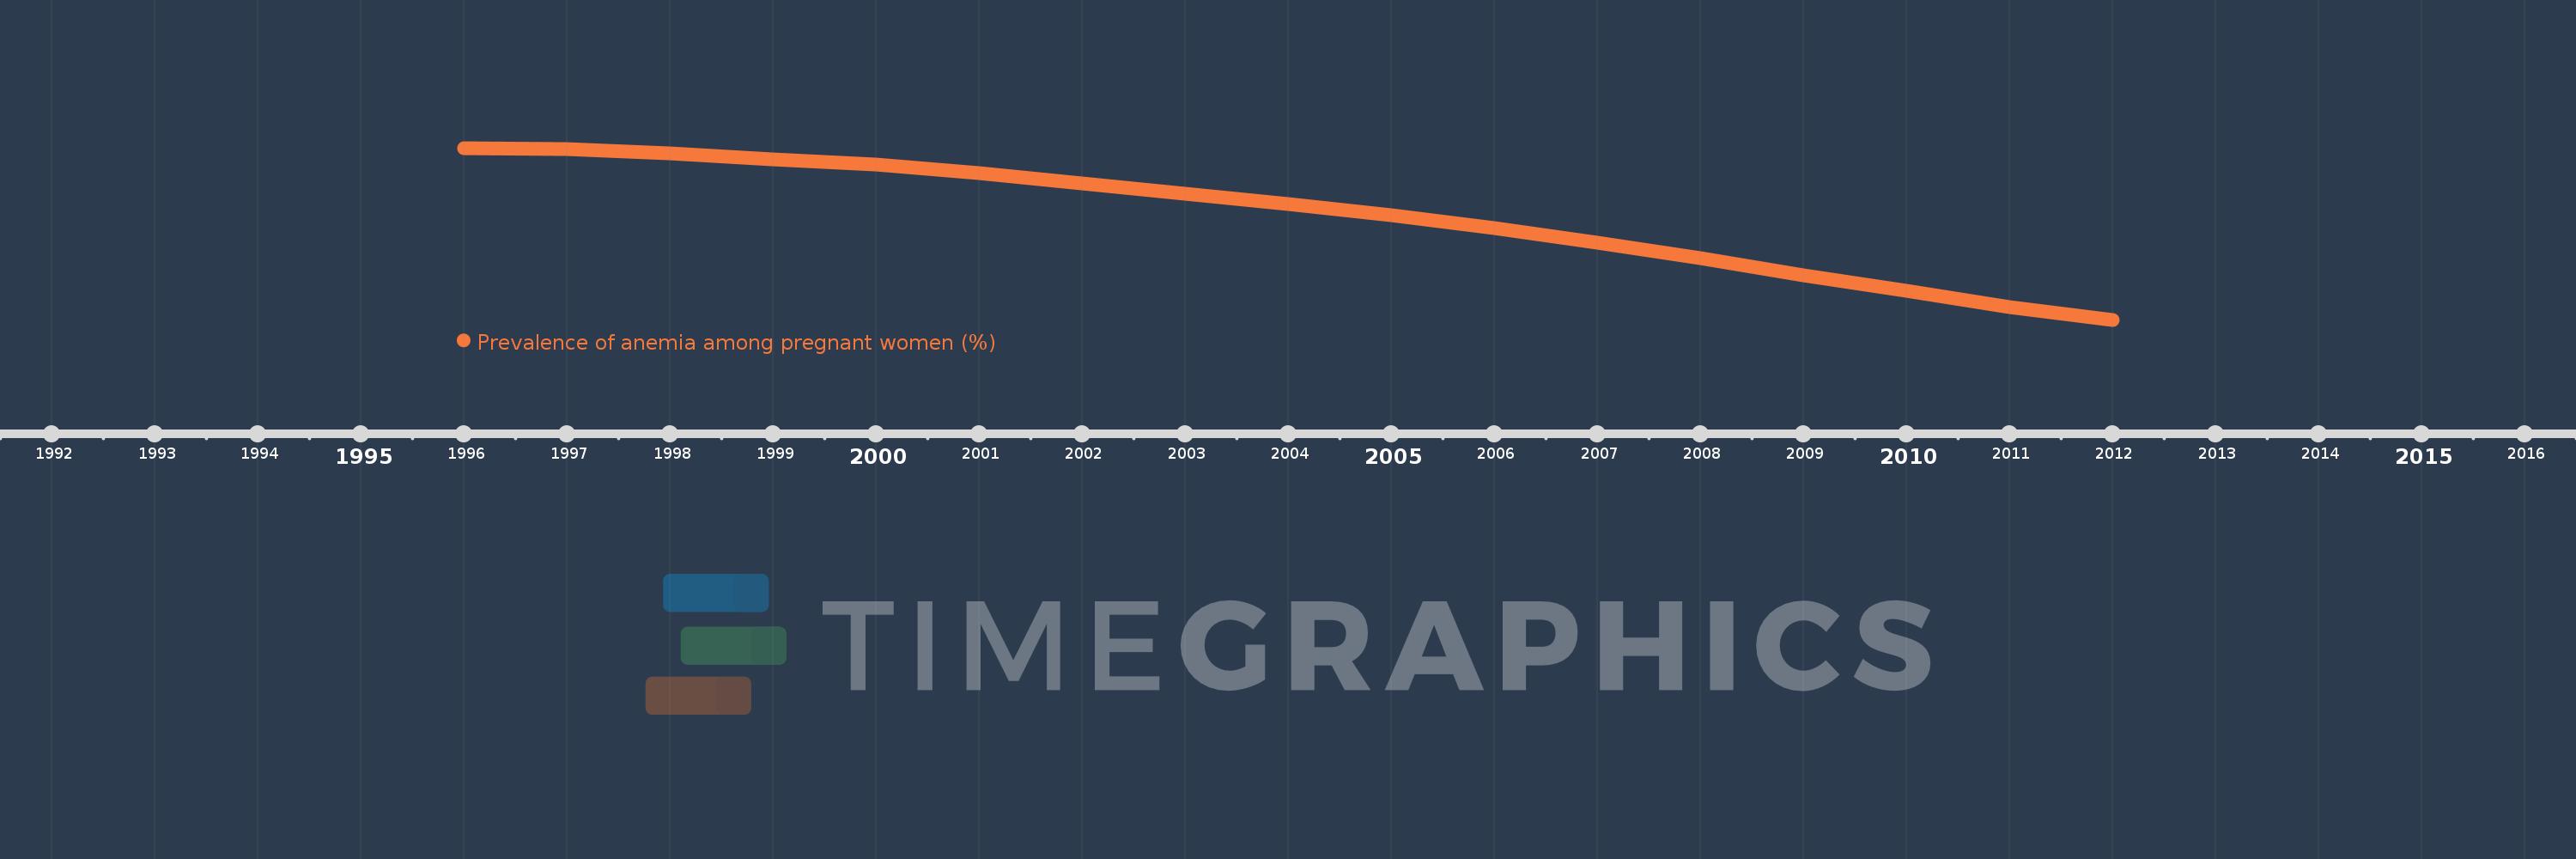
This timeline shows a graph from 1996 to 2012 of IBRD only. No data until 1995. Number of actual observations by date: 17.
Source name:
World Development Indicators
Source organization:
1. WHO. Global anemia prevalence and trends 1995-2011. Geneva: World Health Organization; forthcoming. 2. Stevens GA, Finucane MM, De-Regil LM, et al. Global, regional, and national trends in hemoglobin concentration and prevalence of total and severe anemia in children and pregnant and non-pregnant women for 1995-2011: a systematic analysis of population-representative data. The Lancet Global Health 2013; 1(1): e16-e25.
Categories, topics:
Health
Last updated:
apr 23, 2017
Indicators value changes by year
Meaning:
39.069
Minimum:
35.976
jan 1, 2012
Maximum:
41.079
jan 1, 1996
At the date of observation
Value
Absolute change
Change from the previous value
jan 1, 1996
41.079
+41.079
0.0%
jan 1, 1997
41.041
-0.038
-0.09%
jan 1, 1998
40.911
-0.13
-0.32%
jan 1, 1999
40.741
-0.169
-0.41%
jan 1, 2000
40.585
-0.156
-0.38%
jan 1, 2001
40.322
-0.263
-0.65%
jan 1, 2002
40.021
-0.302
-0.75%
jan 1, 2003
39.722
-0.299
-0.75%
jan 1, 2004
39.414
-0.308
-0.78%
jan 1, 2005
39.078
-0.336
-0.85%
jan 1, 2006
38.707
-0.371
-0.95%
jan 1, 2007
38.277
-0.43
-1.11%
jan 1, 2008
37.794
-0.484
-1.26%
jan 1, 2009
37.304
-0.489
-1.3%
jan 1, 2010
36.839
-0.465
-1.25%
jan 1, 2011
36.36
-0.48
-1.3%
jan 1, 2012
35.976
-0.383
-1.05%
Ranking of countries by current statistics by years
