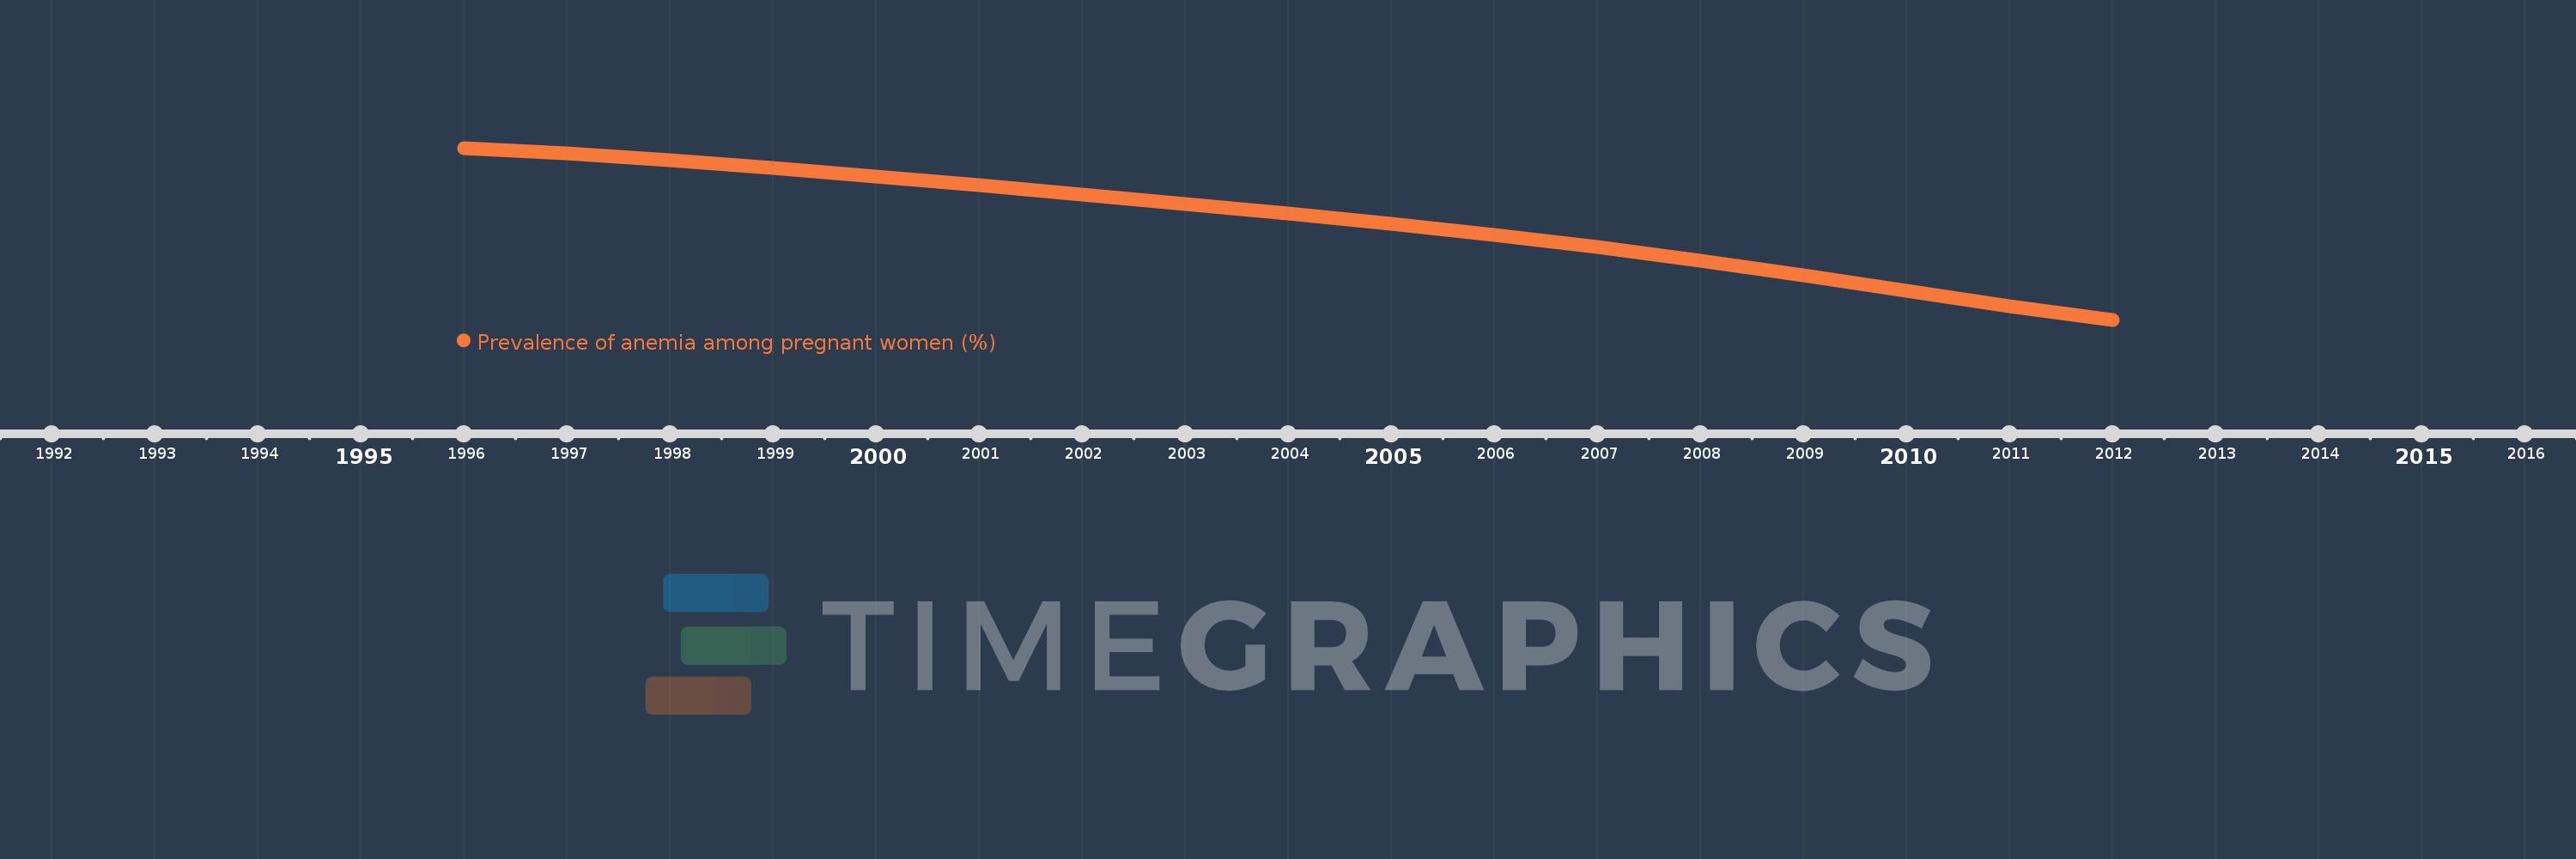
This timeline shows a graph from 1996 to 2012 of Fragile and conflict affected situations. No data until 1995. Number of actual observations by date: 17.
Source name:
World Development Indicators
Source organization:
1. WHO. Global anemia prevalence and trends 1995-2011. Geneva: World Health Organization; forthcoming. 2. Stevens GA, Finucane MM, De-Regil LM, et al. Global, regional, and national trends in hemoglobin concentration and prevalence of total and severe anemia in children and pregnant and non-pregnant women for 1995-2011: a systematic analysis of population-representative data. The Lancet Global Health 2013; 1(1): e16-e25.
Categories, topics:
Health
Last updated:
apr 23, 2017
Indicators value changes by year
Meaning:
46.573
Minimum:
42.202
jan 1, 2012
Maximum:
49.837
jan 1, 1996
At the date of observation
Value
Absolute change
Change from the previous value
jan 1, 1996
49.837
+49.837
0.0%
jan 1, 1997
49.58
-0.257
-0.52%
jan 1, 1998
49.276
-0.304
-0.61%
jan 1, 1999
48.956
-0.32
-0.65%
jan 1, 2000
48.558
-0.398
-0.81%
jan 1, 2001
48.177
-0.382
-0.79%
jan 1, 2002
47.755
-0.422
-0.88%
jan 1, 2003
47.352
-0.402
-0.84%
jan 1, 2004
46.91
-0.442
-0.93%
jan 1, 2005
46.461
-0.449
-0.96%
jan 1, 2006
45.951
-0.51
-1.1%
jan 1, 2007
45.425
-0.526
-1.14%
jan 1, 2008
44.83
-0.596
-1.31%
jan 1, 2009
44.172
-0.658
-1.47%
jan 1, 2010
43.489
-0.683
-1.55%
jan 1, 2011
42.813
-0.676
-1.55%
jan 1, 2012
42.202
-0.611
-1.43%
Ranking of countries by current statistics by years
