29
/
en
AIzaSyAYiBZKx7MnpbEhh9jyipgxe19OcubqV5w
April 1, 2024
39855
IDA total
IDA
false
2
1
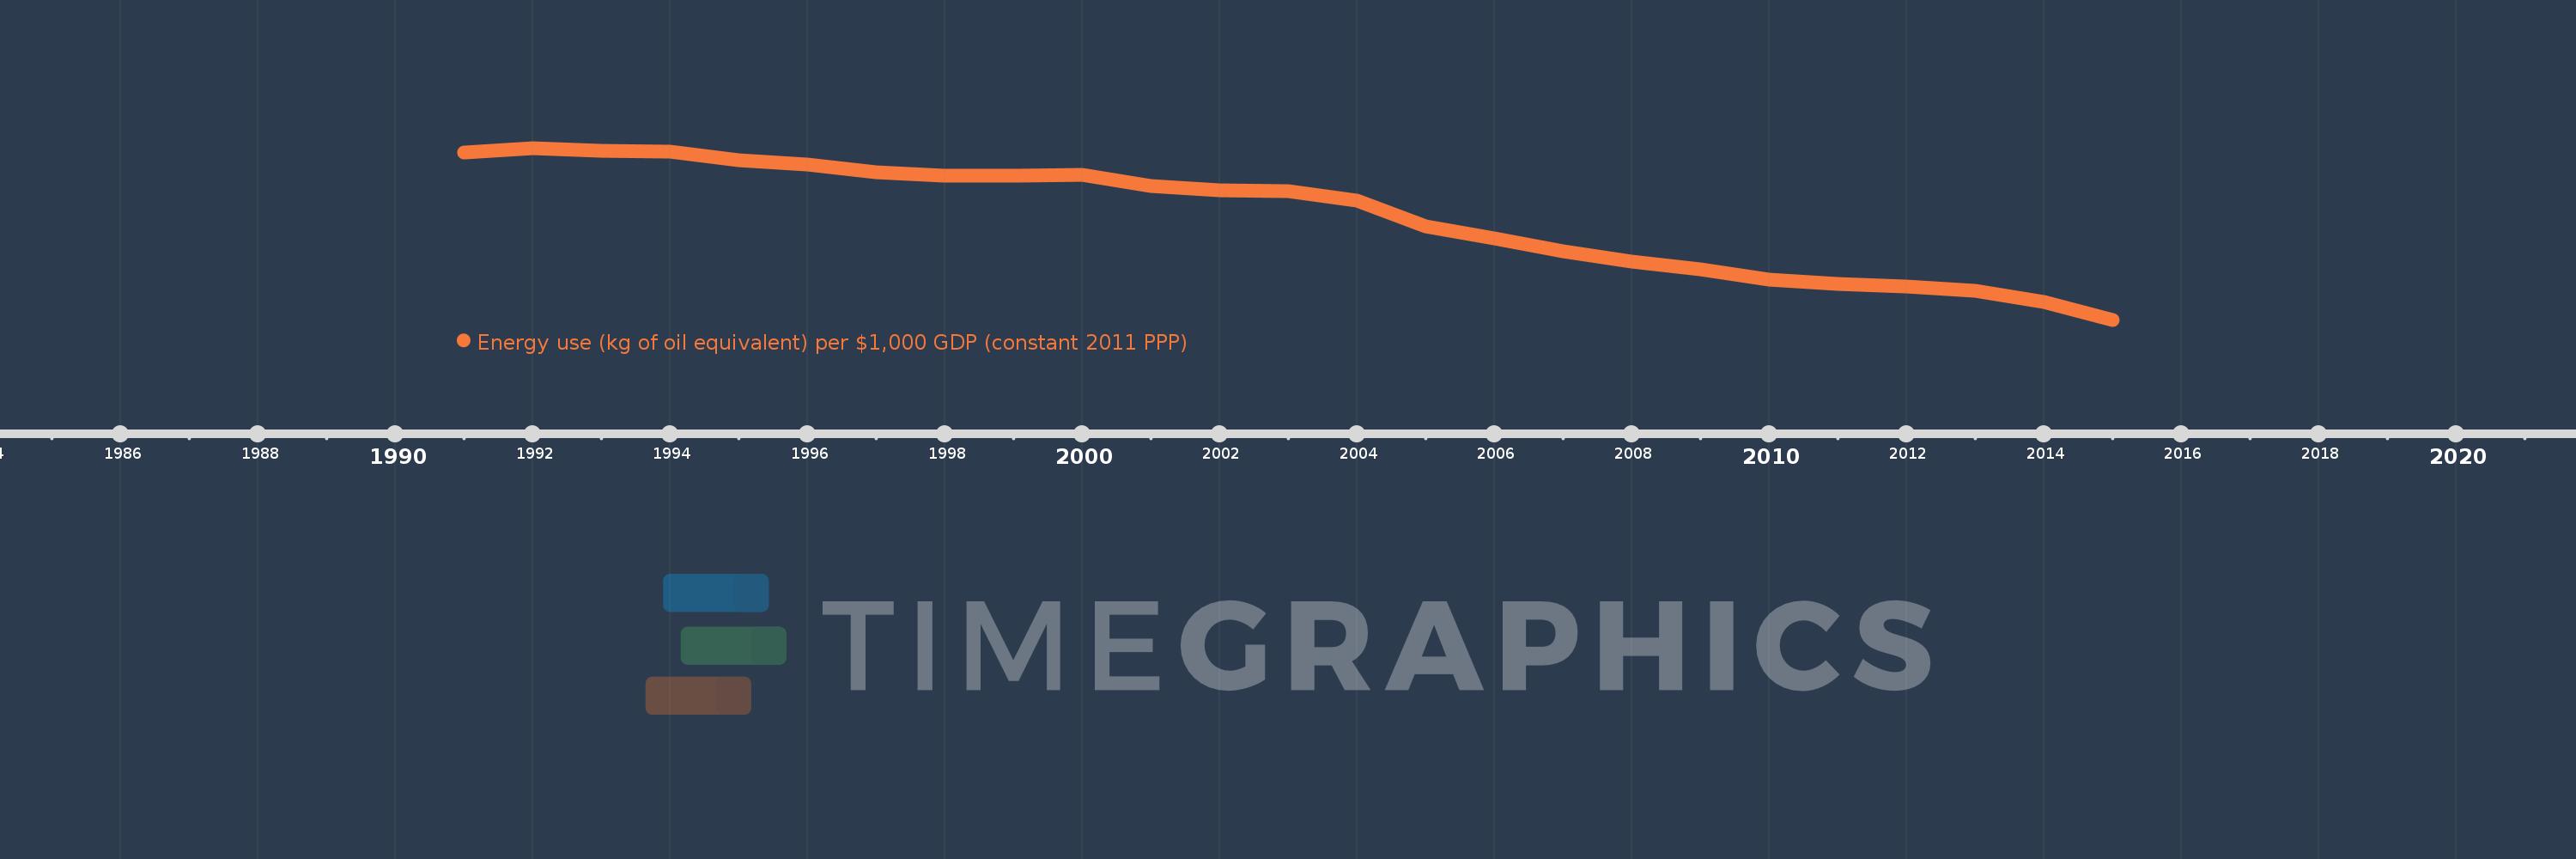
Energy use (kg of oil equivalent) per $1,000 GDP (constant 2011 PPP)
2015,2014,2013,2012,2011,2010,2009,2008,2007,2006,2005,2004,2003,2002,2001,2000,1999,1998,1997,1996,1995,1994,1993,1992,1991
This statistics in other country:
AlbaniaAlgeriaAngolaAntigua and BarbudaArab WorldArgentinaArmeniaAustraliaAustriaAzerbaijanBahamas, TheBahrainBangladeshBarbadosBelarusBelgiumBelizeBeninBhutanBoliviaBosnia and HerzegovinaBotswanaBrazilBrunei DarussalamBulgariaCabo VerdeCambodiaCameroonCanadaCaribbean small statesCentral Europe and the BalticsChileChinaColombiaComorosCongo, Dem. Rep.Congo, Rep.Costa RicaCote d'IvoireCroatiaCubaCyprusCzech RepublicDenmarkDjiboutiDominicaDominican RepublicEarly-demographic dividendEast Asia & PacificEast Asia & Pacific (excluding high income)East Asia & Pacific (IDA & IBRD countries)EcuadorEgypt, Arab Rep.El SalvadorEquatorial GuineaEritreaEstoniaEthiopiaEuro areaEurope & Central AsiaEurope & Central Asia (excluding high income)Europe & Central Asia (IDA & IBRD countries)European UnionFijiFinlandFranceGabonGambia, TheGeorgiaGermanyGhanaGreeceGrenadaGuatemalaGuinea-BissauGuyanaHaitiHeavily indebted poor countries (HIPC)High incomeHondurasHong Kong SAR, ChinaHungaryIBRD onlyIcelandIDA & IBRD totalIDA blendIDA onlyIDA totalIndiaIndonesiaIran, Islamic Rep.IraqIrelandIsraelItalyJamaicaJapanJordanKazakhstanKenyaKiribatiKorea, Rep.KosovoKuwaitKyrgyz RepublicLate-demographic dividendLatin America & Caribbean Latin America & Caribbean (excluding high income)Latin America & the Caribbean (IDA & IBRD countries)LatviaLeast developed countries: UN classificationLebanonLesothoLibyaLithuaniaLow & middle incomeLower middle incomeLuxembourgMacedonia, FYRMalaysiaMaldivesMaltaMarshall IslandsMauritiusMexicoMiddle East & North AfricaMiddle East & North Africa (excluding high income)Middle East & North Africa (IDA & IBRD countries)Middle incomeMoldovaMongoliaMontenegroMoroccoMozambiqueMyanmarNamibiaNepalNetherlandsNew ZealandNicaraguaNigerNigeriaNorth AmericaNorwayOECD membersOmanOther small statesPacific island small statesPakistanPanamaParaguayPeruPhilippinesPolandPortugalPost-demographic dividendPre-demographic dividendQatarRomaniaRussian FederationSamoaSao Tome and PrincipeSaudi ArabiaSenegalSerbiaSeychellesSingaporeSlovak RepublicSloveniaSmall statesSolomon IslandsSouth AfricaSouth AsiaSouth Asia (IDA & IBRD)South SudanSpainSri LankaSt. Kitts and NevisSt. LuciaSt. Vincent and the GrenadinesSub-Saharan Africa Sub-Saharan Africa (excluding high income)Sub-Saharan Africa (IDA & IBRD countries)SudanSurinameSwazilandSwedenSwitzerlandTajikistanTanzaniaThailandTimor-LesteTogoTongaTrinidad and TobagoTunisiaTurkeyTurkmenistanUkraineUnited Arab EmiratesUnited KingdomUnited StatesUpper middle incomeUruguayUzbekistanVanuatuVenezuela, RBVietnamWorldYemen, Rep.ZambiaZimbabwe Timeline:
This timeline shows a graph from 1991 to 2015 of IDA total. No data until 1990. Number of actual observations by date: 25.
Source name:
World Development Indicators
Source organization:
IEA Statistics © OECD/IEA 2014 (http://www.iea.org/stats/index.asp), subject to https://www.iea.org/t&c/termsandconditions/
Categories, topics:
Energy & Mining, Climate Change
Last updated:
apr 23, 2017
Indicators value changes by year
Minimum:
131.779
jan 1, 2015
Maximum:
217.265
jan 1, 1992
At the date of observation
Value
Absolute change
Change from previous value
jan 1, 1991
214.886
+214.886
0.0%
jan 1, 1992
217.265
+2.38
1.11%
jan 1, 1993
215.657
-1.609
-0.74%
jan 1, 1994
215.299
-0.357
-0.17%
jan 1, 1995
211.223
-4.077
-1.89%
jan 1, 1996
209.181
-2.042
-0.97%
jan 1, 1997
205.222
-3.959
-1.89%
jan 1, 1998
203.52
-1.702
-0.83%
jan 1, 1999
203.272
-0.248
-0.12%
jan 1, 2000
203.702
+0.43
0.21%
jan 1, 2001
198.221
-5.481
-2.69%
jan 1, 2002
196.163
-2.058
-1.04%
jan 1, 2003
195.699
-0.464
-0.24%
jan 1, 2004
190.944
-4.755
-2.43%
jan 1, 2005
178.041
-12.903
-6.76%
jan 1, 2006
172.197
-5.844
-3.28%
jan 1, 2007
165.96
-6.237
-3.62%
jan 1, 2008
160.503
-5.457
-3.29%
jan 1, 2009
157.051
-3.453
-2.15%
jan 1, 2010
151.793
-5.258
-3.35%
jan 1, 2011
149.77
-2.022
-1.33%
jan 1, 2012
148.526
-1.244
-0.83%
jan 1, 2013
146.197
-2.329
-1.57%
jan 1, 2014
140.476
-5.721
-3.91%
jan 1, 2015
131.779
-8.697
-6.19%
Ranking of countries by current statistics by years


Comments: