29
/
en
AIzaSyAYiBZKx7MnpbEhh9jyipgxe19OcubqV5w
April 1, 2024
169834
Korea, Rep.
KOR
true
2
1
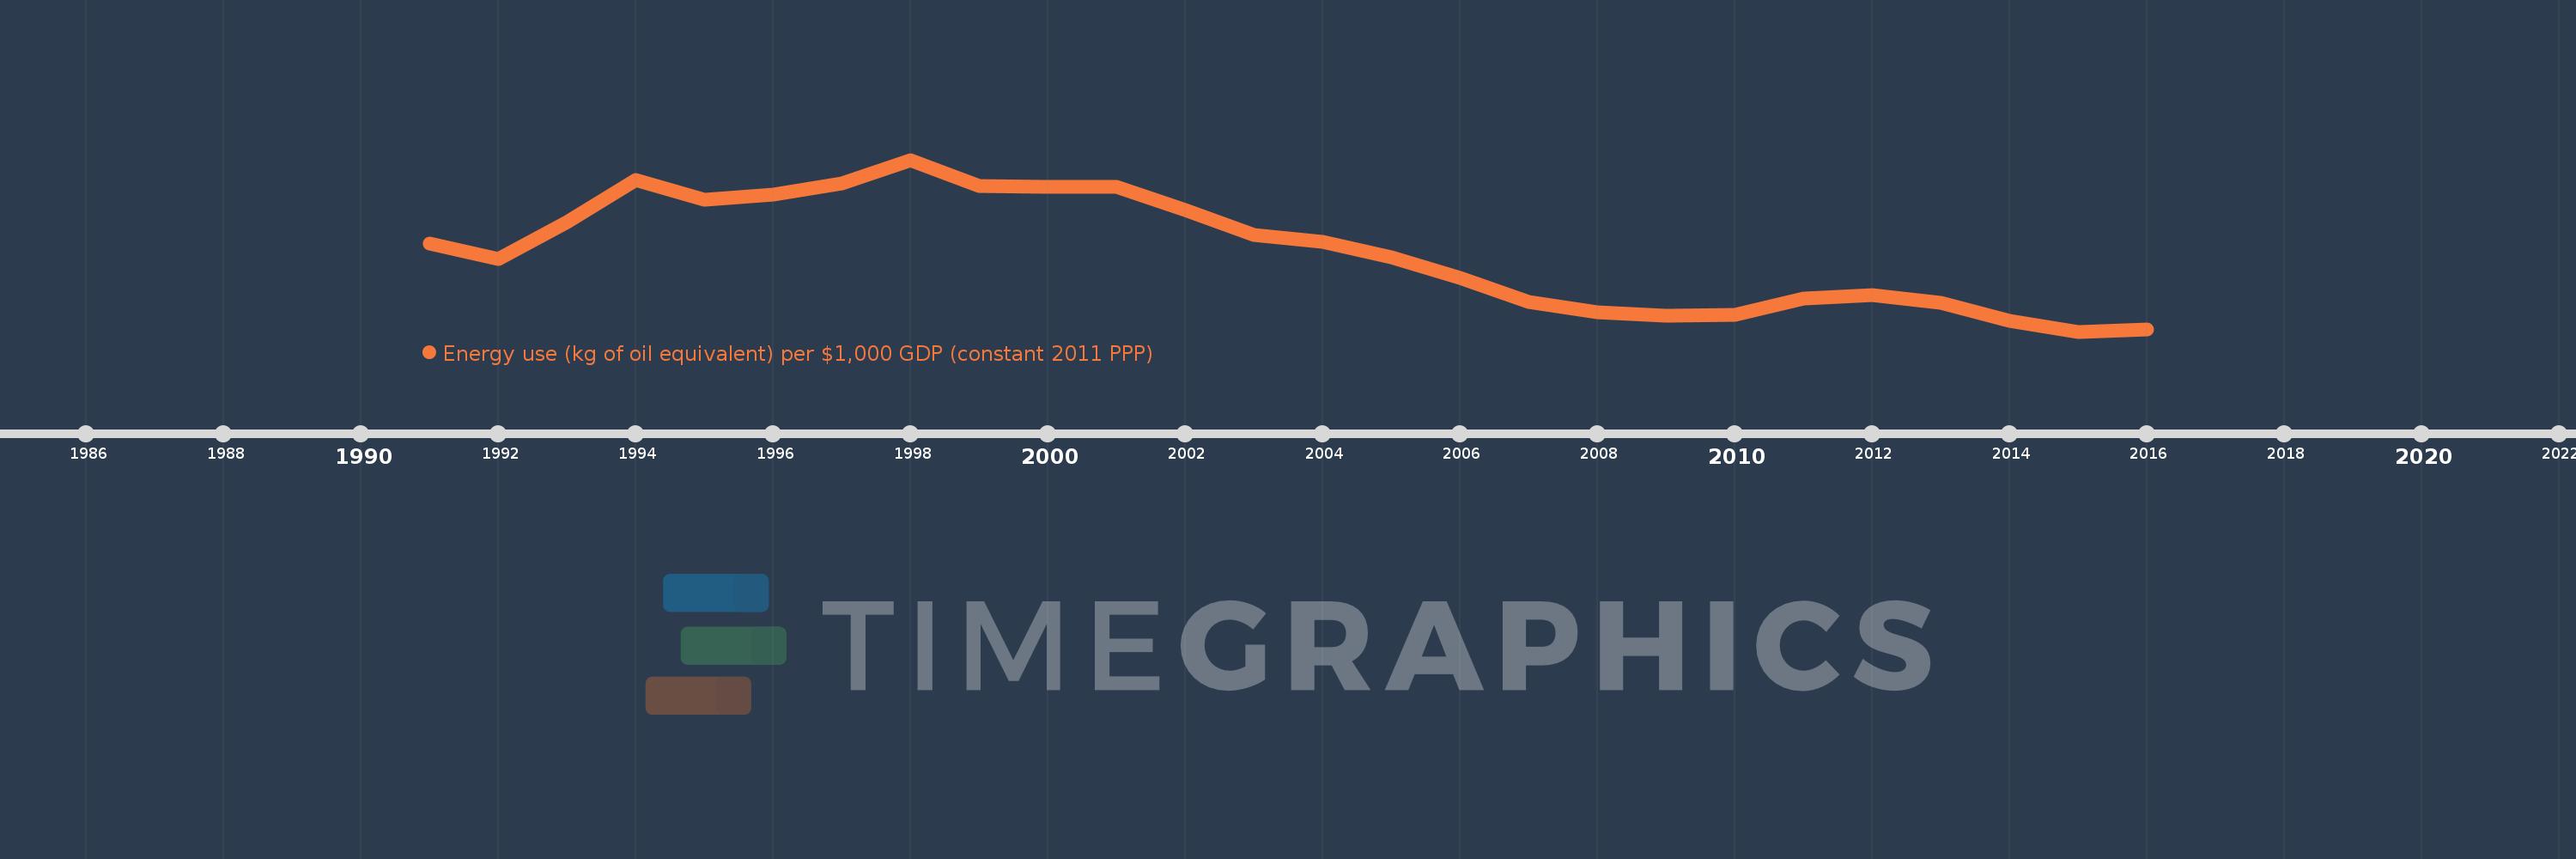
Energy use (kg of oil equivalent) per $1,000 GDP (constant 2011 PPP)
2016,2015,2014,2013,2012,2011,2010,2009,2008,2007,2006,2005,2004,2003,2002,2001,2000,1999,1998,1997,1996,1995,1994,1993,1992,1991
This statistics in other country:
AlbaniaAlgeriaAngolaAntigua and BarbudaArab WorldArgentinaArmeniaAustraliaAustriaAzerbaijanBahamas, TheBahrainBangladeshBarbadosBelarusBelgiumBelizeBeninBhutanBoliviaBosnia and HerzegovinaBotswanaBrazilBrunei DarussalamBulgariaCabo VerdeCambodiaCameroonCanadaCaribbean small statesCentral Europe and the BalticsChileChinaColombiaComorosCongo, Dem. Rep.Congo, Rep.Costa RicaCote d'IvoireCroatiaCubaCyprusCzech RepublicDenmarkDjiboutiDominicaDominican RepublicEarly-demographic dividendEast Asia & PacificEast Asia & Pacific (excluding high income)East Asia & Pacific (IDA & IBRD countries)EcuadorEgypt, Arab Rep.El SalvadorEquatorial GuineaEritreaEstoniaEthiopiaEuro areaEurope & Central AsiaEurope & Central Asia (excluding high income)Europe & Central Asia (IDA & IBRD countries)European UnionFijiFinlandFranceGabonGambia, TheGeorgiaGermanyGhanaGreeceGrenadaGuatemalaGuinea-BissauGuyanaHaitiHeavily indebted poor countries (HIPC)High incomeHondurasHong Kong SAR, ChinaHungaryIBRD onlyIcelandIDA & IBRD totalIDA blendIDA onlyIDA totalIndiaIndonesiaIran, Islamic Rep.IraqIrelandIsraelItalyJamaicaJapanJordanKazakhstanKenyaKiribatiKorea, Rep.KosovoKuwaitKyrgyz RepublicLate-demographic dividendLatin America & Caribbean Latin America & Caribbean (excluding high income)Latin America & the Caribbean (IDA & IBRD countries)LatviaLeast developed countries: UN classificationLebanonLesothoLibyaLithuaniaLow & middle incomeLower middle incomeLuxembourgMacedonia, FYRMalaysiaMaldivesMaltaMarshall IslandsMauritiusMexicoMiddle East & North AfricaMiddle East & North Africa (excluding high income)Middle East & North Africa (IDA & IBRD countries)Middle incomeMoldovaMongoliaMontenegroMoroccoMozambiqueMyanmarNamibiaNepalNetherlandsNew ZealandNicaraguaNigerNigeriaNorth AmericaNorwayOECD membersOmanOther small statesPacific island small statesPakistanPanamaParaguayPeruPhilippinesPolandPortugalPost-demographic dividendPre-demographic dividendQatarRomaniaRussian FederationSamoaSao Tome and PrincipeSaudi ArabiaSenegalSerbiaSeychellesSingaporeSlovak RepublicSloveniaSmall statesSolomon IslandsSouth AfricaSouth AsiaSouth Asia (IDA & IBRD)South SudanSpainSri LankaSt. Kitts and NevisSt. LuciaSt. Vincent and the GrenadinesSub-Saharan Africa Sub-Saharan Africa (excluding high income)Sub-Saharan Africa (IDA & IBRD countries)SudanSurinameSwazilandSwedenSwitzerlandTajikistanTanzaniaThailandTimor-LesteTogoTongaTrinidad and TobagoTunisiaTurkeyTurkmenistanUkraineUnited Arab EmiratesUnited KingdomUnited StatesUpper middle incomeUruguayUzbekistanVanuatuVenezuela, RBVietnamWorldYemen, Rep.ZambiaZimbabwe Timeline:
This timeline shows a graph from 1991 to 2016 of Korea, Rep.. No data until 1990. Number of actual observations by date: 26.
Source name:
World Development Indicators
Source organization:
IEA Statistics © OECD/IEA 2014 (http://www.iea.org/stats/index.asp), subject to https://www.iea.org/t&c/termsandconditions/
Categories, topics:
Energy & Mining, Climate Change
Last updated:
apr 23, 2017
Indicators value changes by year
Minimum:
158.24
jan 1, 2015
Maximum:
199.396
jan 1, 1998
At the date of observation
Value
Absolute change
Change from previous value
jan 1, 1991
179.315
+179.315
0.0%
jan 1, 1992
175.676
-3.64
-2.03%
jan 1, 1993
184.402
+8.727
4.97%
jan 1, 1994
194.542
+10.139
5.5%
jan 1, 1995
189.92
-4.622
-2.38%
jan 1, 1996
191.098
+1.178
0.62%
jan 1, 1997
193.715
+2.617
1.37%
jan 1, 1998
199.396
+5.682
2.93%
jan 1, 1999
193.088
-6.308
-3.16%
jan 1, 2000
192.834
-0.254
-0.13%
jan 1, 2001
192.837
+0.002
0.0%
jan 1, 2002
187.333
-5.504
-2.85%
jan 1, 2003
181.347
-5.985
-3.2%
jan 1, 2004
179.771
-1.576
-0.87%
jan 1, 2005
176.085
-3.686
-2.05%
jan 1, 2006
171.033
-5.052
-2.87%
jan 1, 2007
165.282
-5.751
-3.36%
jan 1, 2008
162.956
-2.326
-1.41%
jan 1, 2009
161.946
-1.009
-0.62%
jan 1, 2010
162.336
+0.39
0.24%
jan 1, 2011
166.232
+3.896
2.4%
jan 1, 2012
167.046
+0.814
0.49%
jan 1, 2013
165.168
-1.878
-1.12%
jan 1, 2014
160.734
-4.434
-2.68%
jan 1, 2015
158.24
-2.494
-1.55%
jan 1, 2016
158.664
+0.424
0.27%
Ranking of countries by current statistics by years


Comments: