29
/
en
AIzaSyAYiBZKx7MnpbEhh9jyipgxe19OcubqV5w
April 1, 2024
228391
Romania
ROU
true
2
1
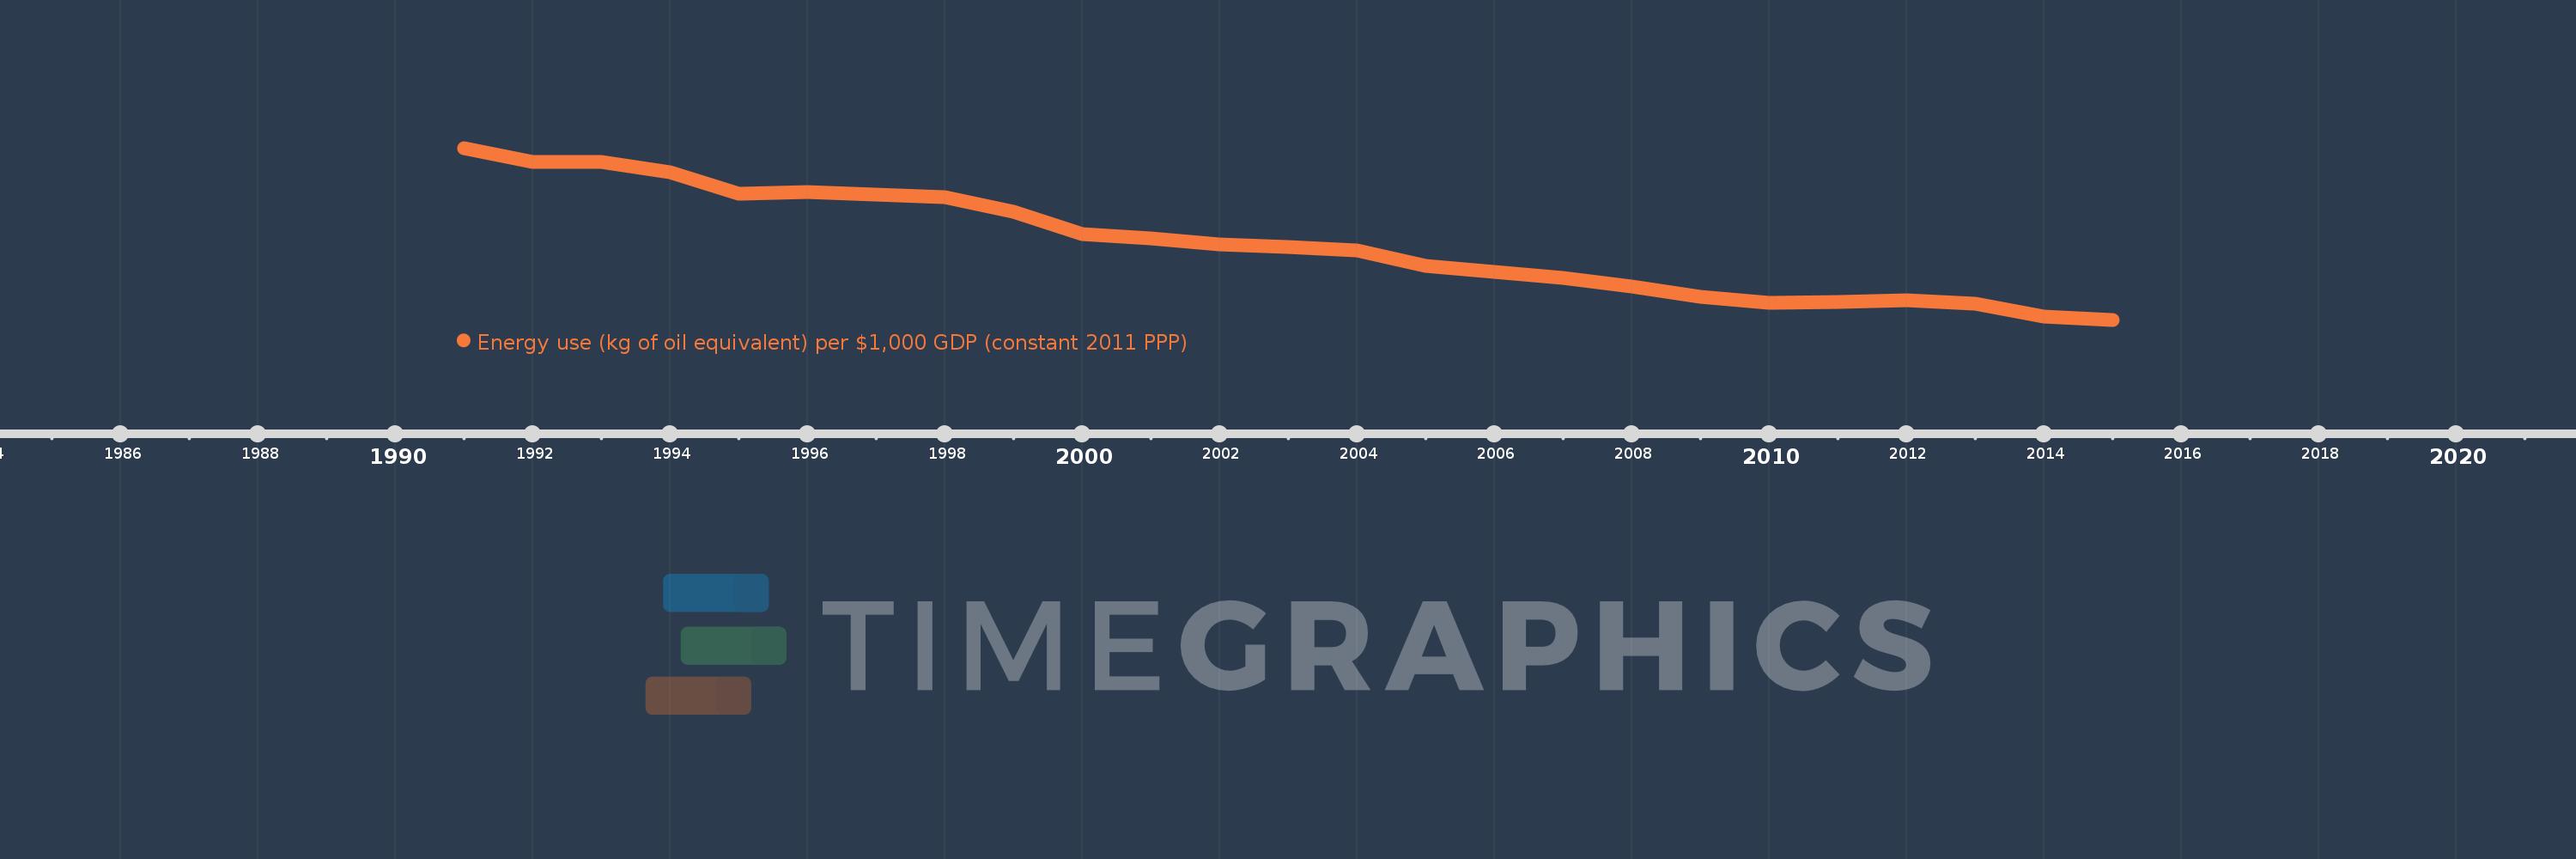
Energy use (kg of oil equivalent) per $1,000 GDP (constant 2011 PPP)
2015,2014,2013,2012,2011,2010,2009,2008,2007,2006,2005,2004,2003,2002,2001,2000,1999,1998,1997,1996,1995,1994,1993,1992,1991
This statistics in other country:
AlbaniaAlgeriaAngolaAntigua and BarbudaArab WorldArgentinaArmeniaAustraliaAustriaAzerbaijanBahamas, TheBahrainBangladeshBarbadosBelarusBelgiumBelizeBeninBhutanBoliviaBosnia and HerzegovinaBotswanaBrazilBrunei DarussalamBulgariaCabo VerdeCambodiaCameroonCanadaCaribbean small statesCentral Europe and the BalticsChileChinaColombiaComorosCongo, Dem. Rep.Congo, Rep.Costa RicaCote d'IvoireCroatiaCubaCyprusCzech RepublicDenmarkDjiboutiDominicaDominican RepublicEarly-demographic dividendEast Asia & PacificEast Asia & Pacific (excluding high income)East Asia & Pacific (IDA & IBRD countries)EcuadorEgypt, Arab Rep.El SalvadorEquatorial GuineaEritreaEstoniaEthiopiaEuro areaEurope & Central AsiaEurope & Central Asia (excluding high income)Europe & Central Asia (IDA & IBRD countries)European UnionFijiFinlandFranceGabonGambia, TheGeorgiaGermanyGhanaGreeceGrenadaGuatemalaGuinea-BissauGuyanaHaitiHeavily indebted poor countries (HIPC)High incomeHondurasHong Kong SAR, ChinaHungaryIBRD onlyIcelandIDA & IBRD totalIDA blendIDA onlyIDA totalIndiaIndonesiaIran, Islamic Rep.IraqIrelandIsraelItalyJamaicaJapanJordanKazakhstanKenyaKiribatiKorea, Rep.KosovoKuwaitKyrgyz RepublicLate-demographic dividendLatin America & Caribbean Latin America & Caribbean (excluding high income)Latin America & the Caribbean (IDA & IBRD countries)LatviaLeast developed countries: UN classificationLebanonLesothoLibyaLithuaniaLow & middle incomeLower middle incomeLuxembourgMacedonia, FYRMalaysiaMaldivesMaltaMarshall IslandsMauritiusMexicoMiddle East & North AfricaMiddle East & North Africa (excluding high income)Middle East & North Africa (IDA & IBRD countries)Middle incomeMoldovaMongoliaMontenegroMoroccoMozambiqueMyanmarNamibiaNepalNetherlandsNew ZealandNicaraguaNigerNigeriaNorth AmericaNorwayOECD membersOmanOther small statesPacific island small statesPakistanPanamaParaguayPeruPhilippinesPolandPortugalPost-demographic dividendPre-demographic dividendQatarRomaniaRussian FederationSamoaSao Tome and PrincipeSaudi ArabiaSenegalSerbiaSeychellesSingaporeSlovak RepublicSloveniaSmall statesSolomon IslandsSouth AfricaSouth AsiaSouth Asia (IDA & IBRD)South SudanSpainSri LankaSt. Kitts and NevisSt. LuciaSt. Vincent and the GrenadinesSub-Saharan Africa Sub-Saharan Africa (excluding high income)Sub-Saharan Africa (IDA & IBRD countries)SudanSurinameSwazilandSwedenSwitzerlandTajikistanTanzaniaThailandTimor-LesteTogoTongaTrinidad and TobagoTunisiaTurkeyTurkmenistanUkraineUnited Arab EmiratesUnited KingdomUnited StatesUpper middle incomeUruguayUzbekistanVanuatuVenezuela, RBVietnamWorldYemen, Rep.ZambiaZimbabwe Timeline:
This timeline shows a graph from 1991 to 2015 of Romania. No data until 1990. Number of actual observations by date: 25.
Source name:
World Development Indicators
Source organization:
IEA Statistics © OECD/IEA 2014 (http://www.iea.org/stats/index.asp), subject to https://www.iea.org/t&c/termsandconditions/
Categories, topics:
Energy & Mining, Climate Change
Last updated:
apr 23, 2017
Indicators value changes by year
Minimum:
80.931
jan 1, 2015
Maximum:
233.733
jan 1, 1991
At the date of observation
Value
Absolute change
Change from previous value
jan 1, 1991
233.733
+233.733
0.0%
jan 1, 1992
221.323
-12.41
-5.31%
jan 1, 1993
221.145
-0.178
-0.08%
jan 1, 1994
212.3
-8.844
-4.0%
jan 1, 1995
192.669
-19.631
-9.25%
jan 1, 1996
194.76
+2.091
1.09%
jan 1, 1997
192.046
-2.713
-1.39%
jan 1, 1998
189.762
-2.285
-1.19%
jan 1, 1999
177.221
-12.541
-6.61%
jan 1, 2000
157.228
-19.993
-11.28%
jan 1, 2001
153.392
-3.836
-2.44%
jan 1, 2002
147.651
-5.741
-3.74%
jan 1, 2003
145.399
-2.253
-1.53%
jan 1, 2004
142.81
-2.589
-1.78%
jan 1, 2005
128.984
-13.826
-9.68%
jan 1, 2006
123.524
-5.46
-4.23%
jan 1, 2007
118.299
-5.225
-4.23%
jan 1, 2008
110.209
-8.09
-6.84%
jan 1, 2009
101.24
-8.97
-8.14%
jan 1, 2010
95.913
-5.327
-5.26%
jan 1, 2011
97.098
+1.185
1.24%
jan 1, 2012
98.21
+1.112
1.15%
jan 1, 2013
95.216
-2.993
-3.05%
jan 1, 2014
83.961
-11.255
-11.82%
jan 1, 2015
80.931
-3.03
-3.61%
Ranking of countries by current statistics by years


Comments: