29
/
en
AIzaSyAYiBZKx7MnpbEhh9jyipgxe19OcubqV5w
April 1, 2024
38960
IDA only
IDX
false
2
1
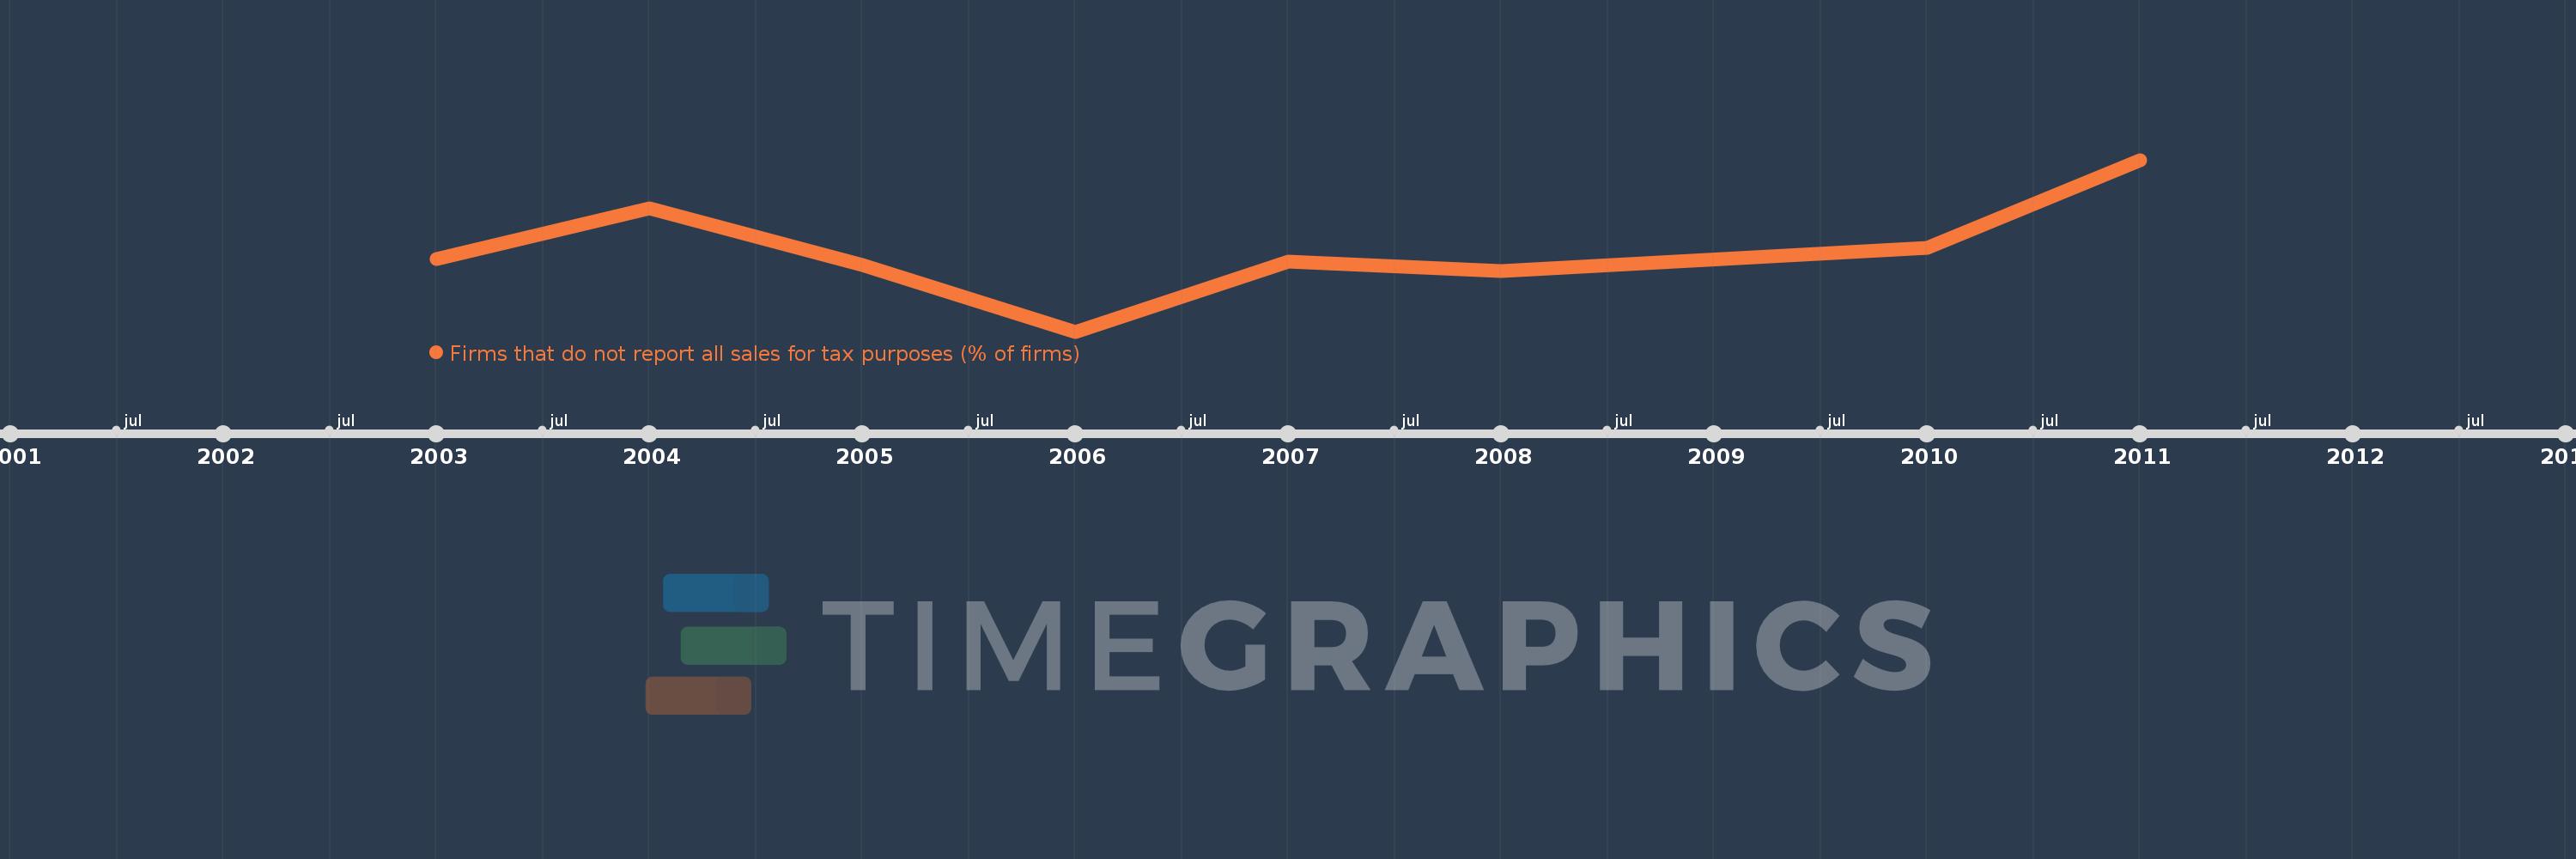
Firms that do not report all sales for tax purposes (% of firms)
2011,2010,2008,2007,2006,2005,2004,2003
This statistics in other country:
Timeline:
This timeline shows a graph from 2003 to 2011 of IDA only. No data until 2002. Number of actual observations by date: 8.
Source name:
World Development Indicators
Source organization:
World Bank, Enterprise Surveys (http://www.enterprisesurveys.org/).
Categories, topics:
Private Sector
Last updated:
apr 23, 2017
Indicators value changes by year
At the date of observation
Value
Absolute change
Change from previous value
jan 1, 2003
58.273
+58.273
0.0%
jan 1, 2004
70.608
+12.334
21.17%
jan 1, 2005
56.955
-13.653
-19.34%
jan 1, 2006
40.82
-16.135
-28.33%
jan 1, 2007
57.714
+16.894
41.39%
jan 1, 2008
55.382
-2.332
-4.04%
jan 1, 2010
61.07
+5.688
10.27%
jan 1, 2011
82.33
+21.26
34.81%
Ranking of countries by current statistics by years


Comments: