Download This statistics in other country:
Timeline:
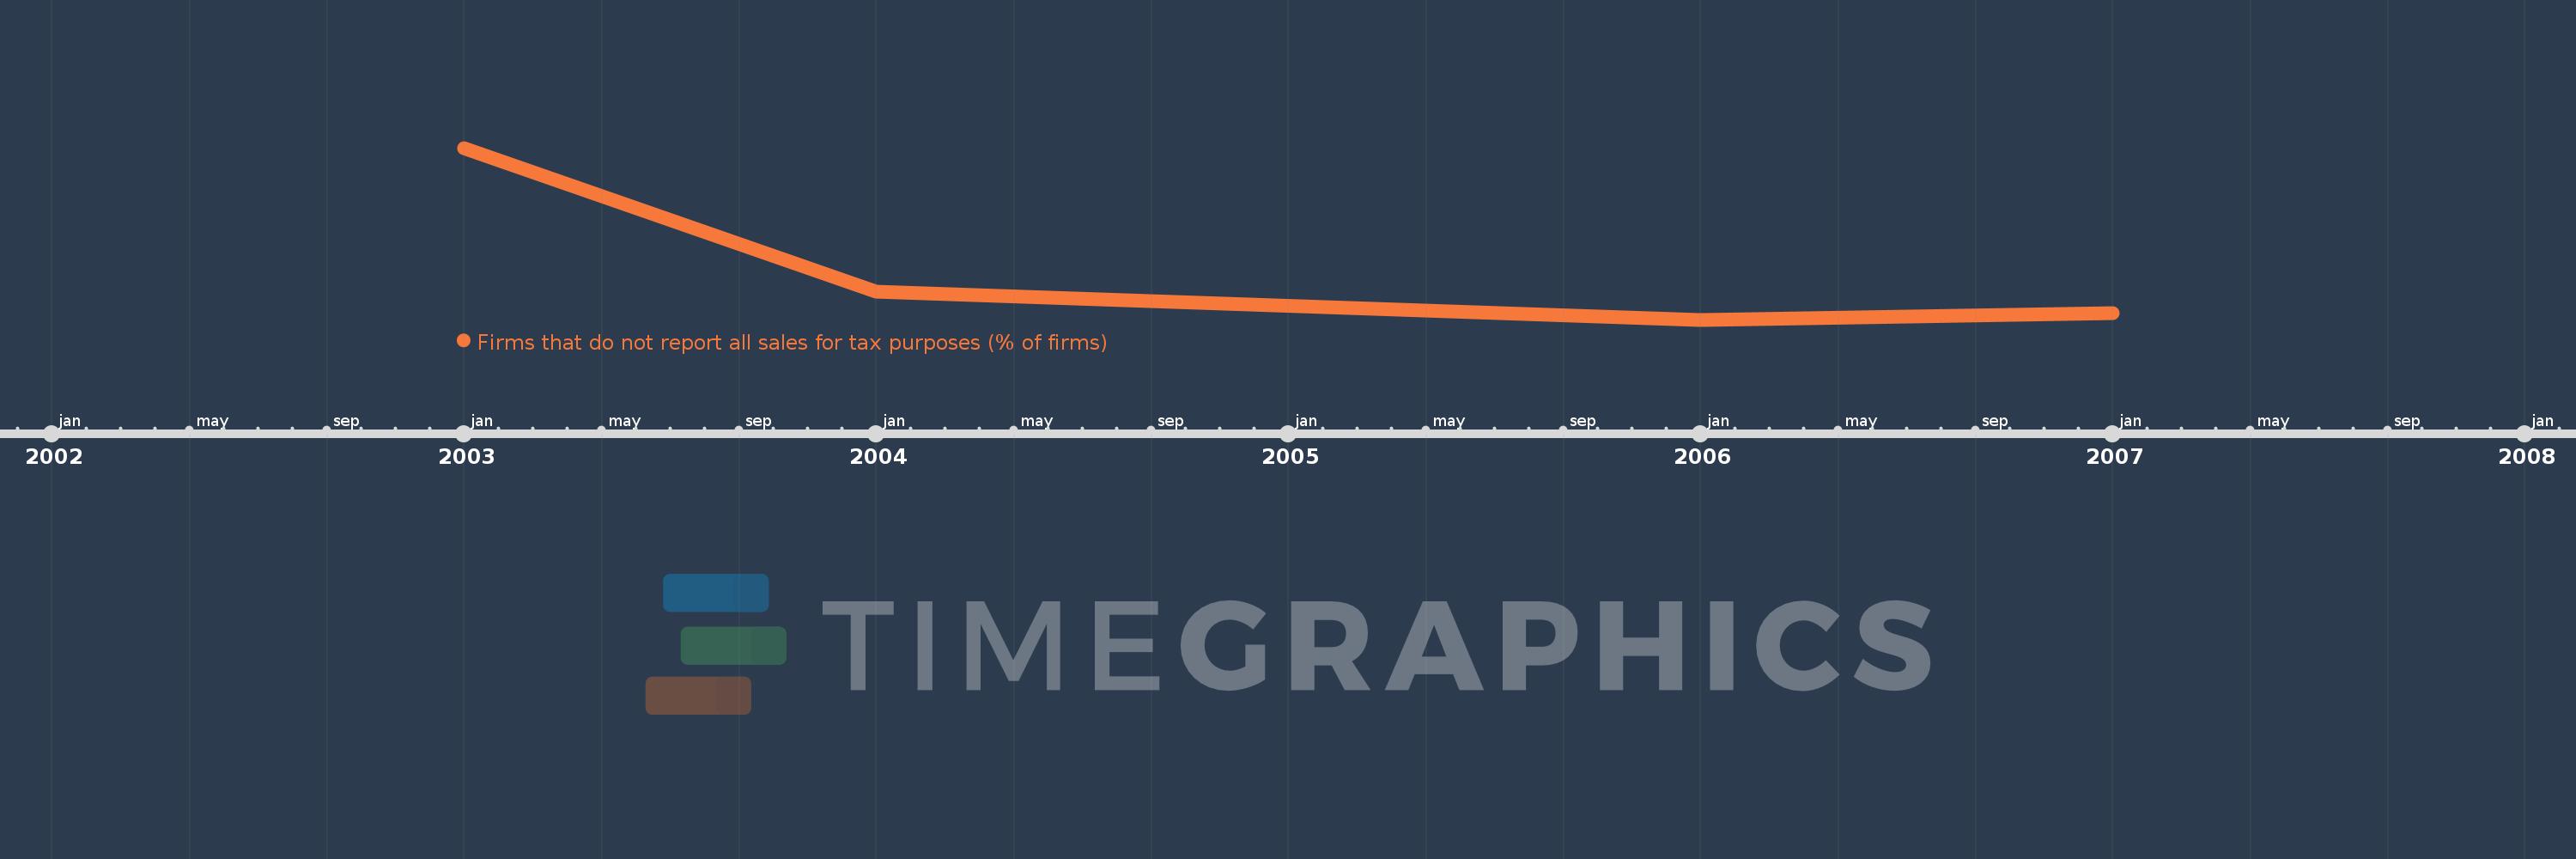
This timeline shows a graph from 2003 to 2007 of High income. No data until 2002. Number of actual observations by date: 4.
Source name:
World Development Indicators
Source organization:
World Bank, Enterprise Surveys (http://www.enterprisesurveys.org/).
Categories, topics:
Private Sector
Last updated:
apr 23, 2017
Indicators value changes by year
Minimum:
36.292
jan 1, 2006
Maximum:
46.964
jan 1, 2003
At the date of observation
Value
Absolute change
Change from the previous value
jan 1, 2003
46.964
+46.964
0.0%
jan 1, 2004
38.06
-8.904
-18.96%
jan 1, 2006
36.292
-1.768
-4.64%
jan 1, 2007
36.71
+0.418
1.15%
Ranking of countries by current statistics by years
