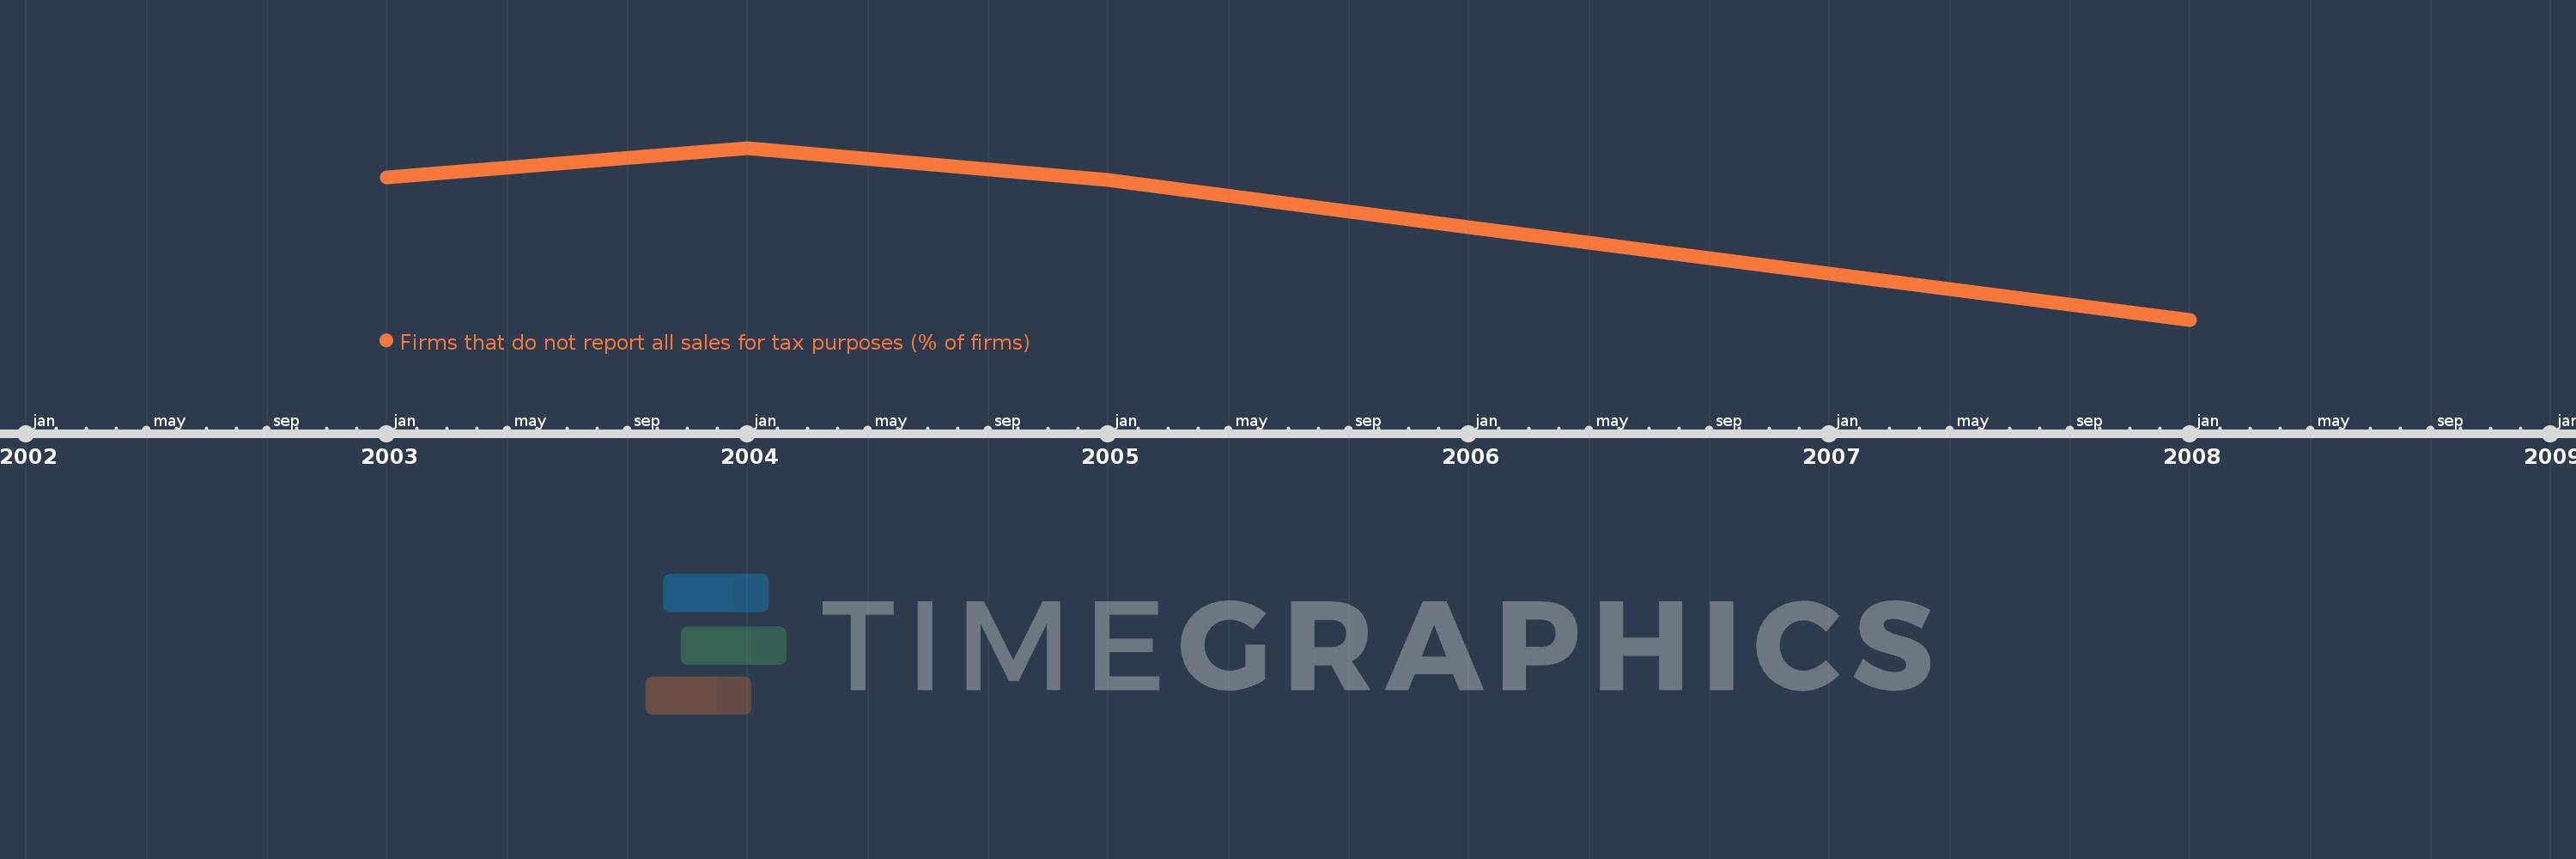
This timeline shows a graph from 2003 to 2008 of Europe & Central Asia (IDA & IBRD countries). No data until 2002. Number of actual observations by date: 5.
Source name:
World Development Indicators
Source organization:
World Bank, Enterprise Surveys (http://www.enterprisesurveys.org/).
Categories, topics:
Private Sector
Last updated:
apr 23, 2017
Indicators value changes by year
Meaning:
42.58
Minimum:
16.38
jan 1, 2008
Maximum:
57.587
jan 1, 2004
At the date of observation
Value
Absolute change
Change from the previous value
jan 1, 2003
50.536
+50.536
0.0%
jan 1, 2004
57.587
+7.051
13.95%
jan 1, 2005
49.875
-7.712
-13.39%
jan 1, 2006
38.523
-11.352
-22.76%
jan 1, 2008
16.38
-22.143
-57.48%
Ranking of countries by current statistics by years
