29
/
en
AIzaSyAYiBZKx7MnpbEhh9jyipgxe19OcubqV5w
April 1, 2024
38276
IDA blend
IDB
false
2
1
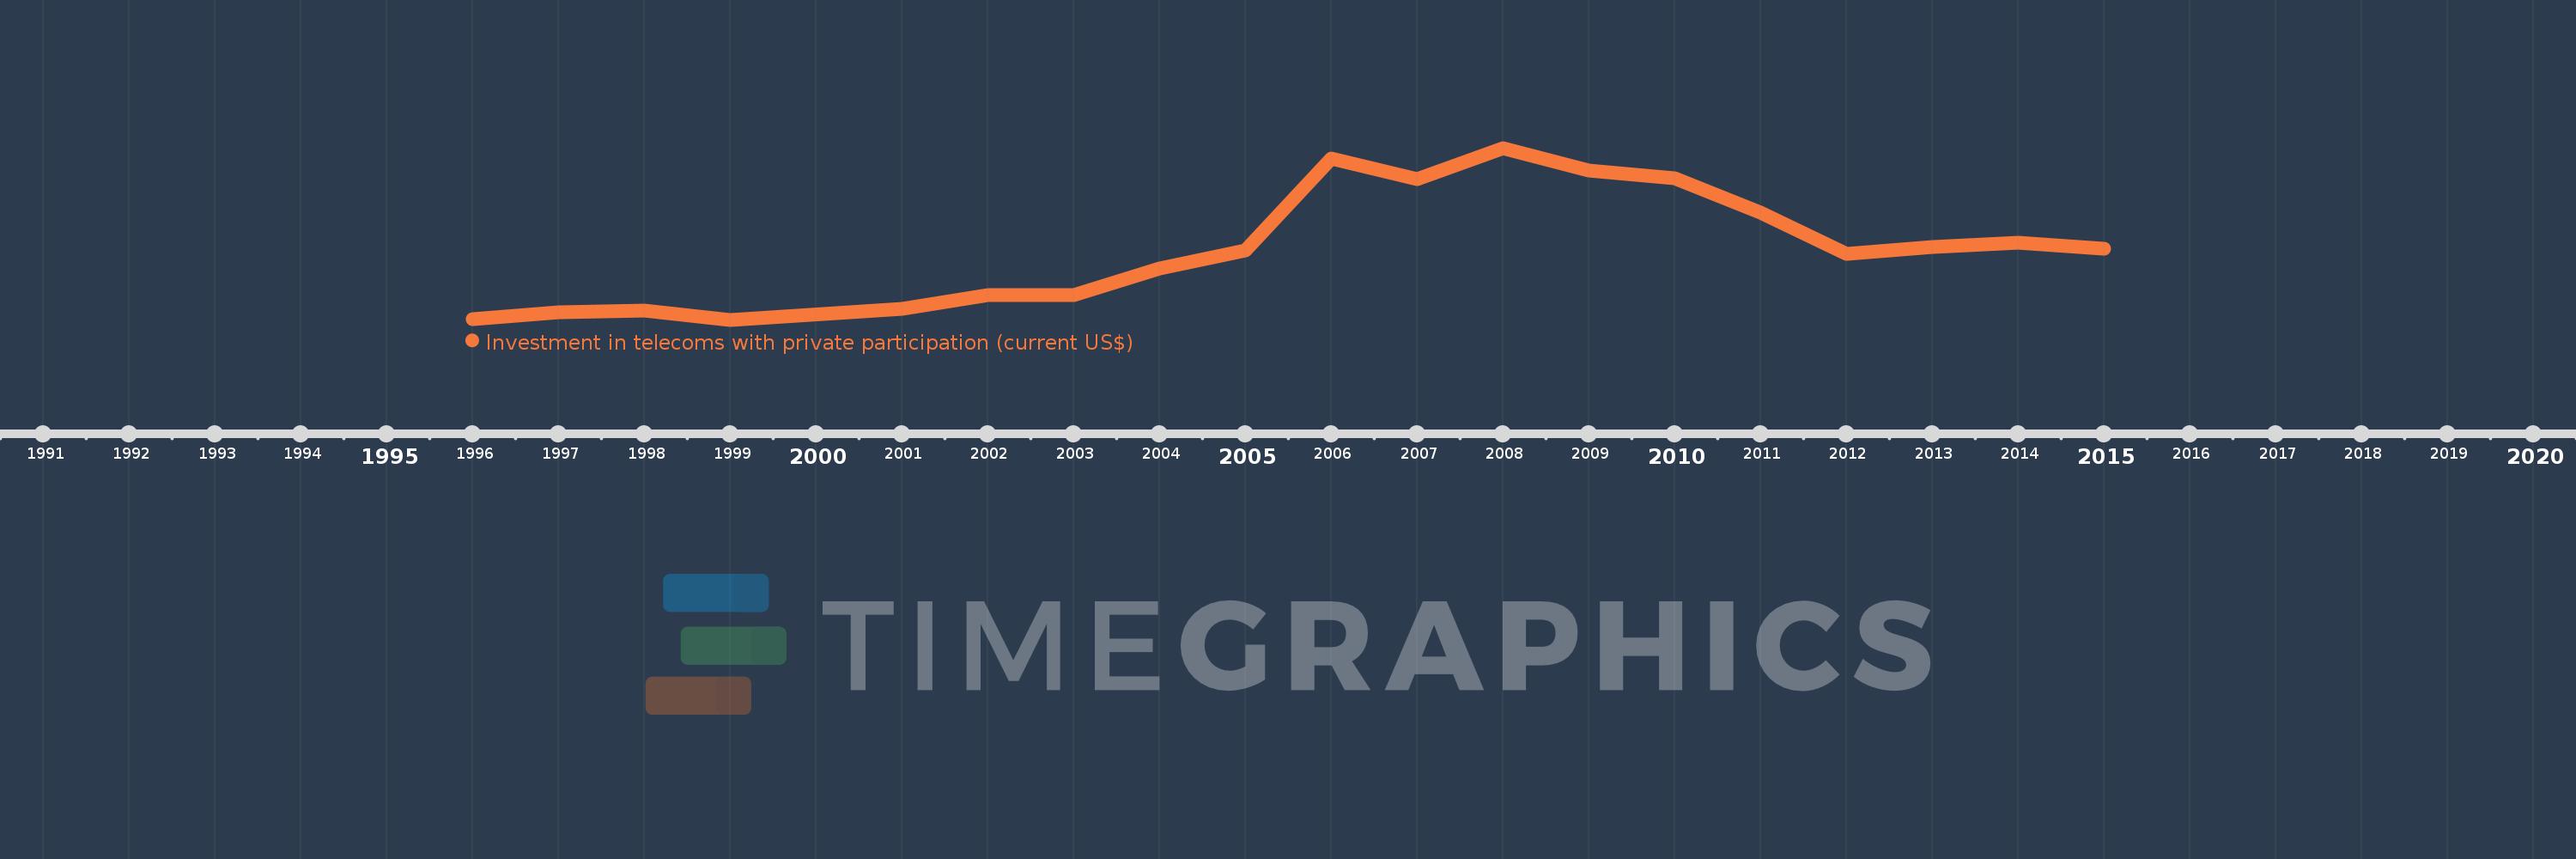
Investment in telecoms with private participation (current US$)
2015,2014,2013,2012,2011,2010,2009,2008,2007,2006,2005,2004,2003,2002,2001,1999,1998,1997,1996
This statistics in other country:
AfghanistanAlbaniaAlgeriaAmerican SamoaAngolaAntigua and BarbudaArgentinaArmeniaAzerbaijanBangladeshBelarusBelizeBeninBhutanBoliviaBosnia and HerzegovinaBotswanaBrazilBulgariaBurkina FasoBurundiCabo VerdeCambodiaCameroonCentral African RepublicChadChileChinaColombiaCongo, Dem. Rep.Congo, Rep.Costa RicaCote d'IvoireCubaDominicaDominican RepublicEarly-demographic dividendEast Asia & Pacific (excluding high income)East Asia & Pacific (IDA & IBRD countries)EcuadorEgypt, Arab Rep.El SalvadorEritreaEthiopiaEurope & Central Asia (excluding high income)Europe & Central Asia (IDA & IBRD countries)FijiFragile and conflict affected situationsGabonGambia, TheGeorgiaGhanaGrenadaGuatemalaGuineaGuinea-BissauGuyanaHaitiHeavily indebted poor countries (HIPC)HondurasIBRD onlyIDA & IBRD totalIDA blendIDA onlyIDA totalIndiaIndonesiaIran, Islamic Rep.IraqJamaicaJordanKazakhstanKenyaKiribatiKorea, Dem. People’s Rep.KosovoKyrgyz RepublicLao PDRLate-demographic dividendLatin America & Caribbean Latin America & Caribbean (excluding high income)Latin America & the Caribbean (IDA & IBRD countries)Least developed countries: UN classificationLebanonLesothoLiberiaLithuaniaLow & middle incomeLow incomeLower middle incomeMacedonia, FYRMadagascarMalawiMalaysiaMaldivesMaliMauritaniaMauritiusMexicoMicronesia, Fed. Sts.Middle East & North Africa (excluding high income)Middle East & North Africa (IDA & IBRD countries)Middle incomeMoldovaMongoliaMontenegroMoroccoMozambiqueMyanmarNamibiaNepalNicaraguaNigerNigeriaOther small statesPacific island small statesPakistanPanamaPapua New GuineaParaguayPeruPhilippinesPre-demographic dividendRomaniaRussian FederationRwandaSamoaSenegalSerbiaSeychellesSierra LeoneSomaliaSouth AfricaSouth AsiaSouth Asia (IDA & IBRD)South SudanSri LankaSt. Kitts and NevisSt. LuciaSt. Vincent and the GrenadinesSub-Saharan Africa Sub-Saharan Africa (excluding high income)Sub-Saharan Africa (IDA & IBRD countries)SudanSurinameSwazilandSyrian Arab RepublicTajikistanTanzaniaThailandTimor-LesteTogoTongaTunisiaTurkeyTurkmenistanUgandaUkraineUpper middle incomeUruguayUzbekistanVanuatuVenezuela, RBVietnamWest Bank and GazaYemen, Rep.ZambiaZimbabwe Timeline:
This timeline shows a graph from 1996 to 2015 of IDA blend. No data until 1995. Number of actual observations by date: 19.
Source name:
World Development Indicators
Source organization:
World Bank, Private Participation in Infrastructure Project Database (http://ppi.worldbank.org).
Categories, topics:
Infrastructure, Private Sector
Last updated:
apr 23, 2017
Indicators value changes by year
Minimum:
296.36 mln
jan 1, 1999
Maximum:
7.544 bln
jan 1, 2008
At the date of observation
Value
Absolute change
Change from previous value
jan 1, 1996
332.2 mln
+332.2 mln
0.0%
jan 1, 1997
618.0 mln
+285.8 mln
86.03%
jan 1, 1998
695.2 mln
+77.2 mln
12.49%
jan 1, 1999
296.36 mln
-398.84 mln
-57.37%
jan 1, 2001
759.6 mln
+463.24 mln
156.31%
jan 1, 2002
1.324 bln
+564.8 mln
74.35%
jan 1, 2003
1.32 bln
-4.5 mln
-0.34%
jan 1, 2004
2.451 bln
+1.131 bln
85.68%
jan 1, 2005
3.215 bln
+764.5 mln
31.19%
jan 1, 2006
7.112 bln
+3.896 bln
121.18%
jan 1, 2007
6.234 bln
-877.55 mln
-12.34%
jan 1, 2008
7.544 bln
+1.31 bln
21.01%
jan 1, 2009
6.591 bln
-953.3 mln
-12.64%
jan 1, 2010
6.267 bln
-323.7 mln
-4.91%
jan 1, 2011
4.817 bln
-1.45 bln
-23.14%
jan 1, 2012
3.066 bln
-1.751 bln
-36.35%
jan 1, 2013
3.369 bln
+303.3 mln
9.89%
jan 1, 2014
3.555 bln
+186.0 mln
5.52%
jan 1, 2015
3.305 bln
-250.8 mln
-7.05%
Ranking of countries by current statistics by years


Comments: