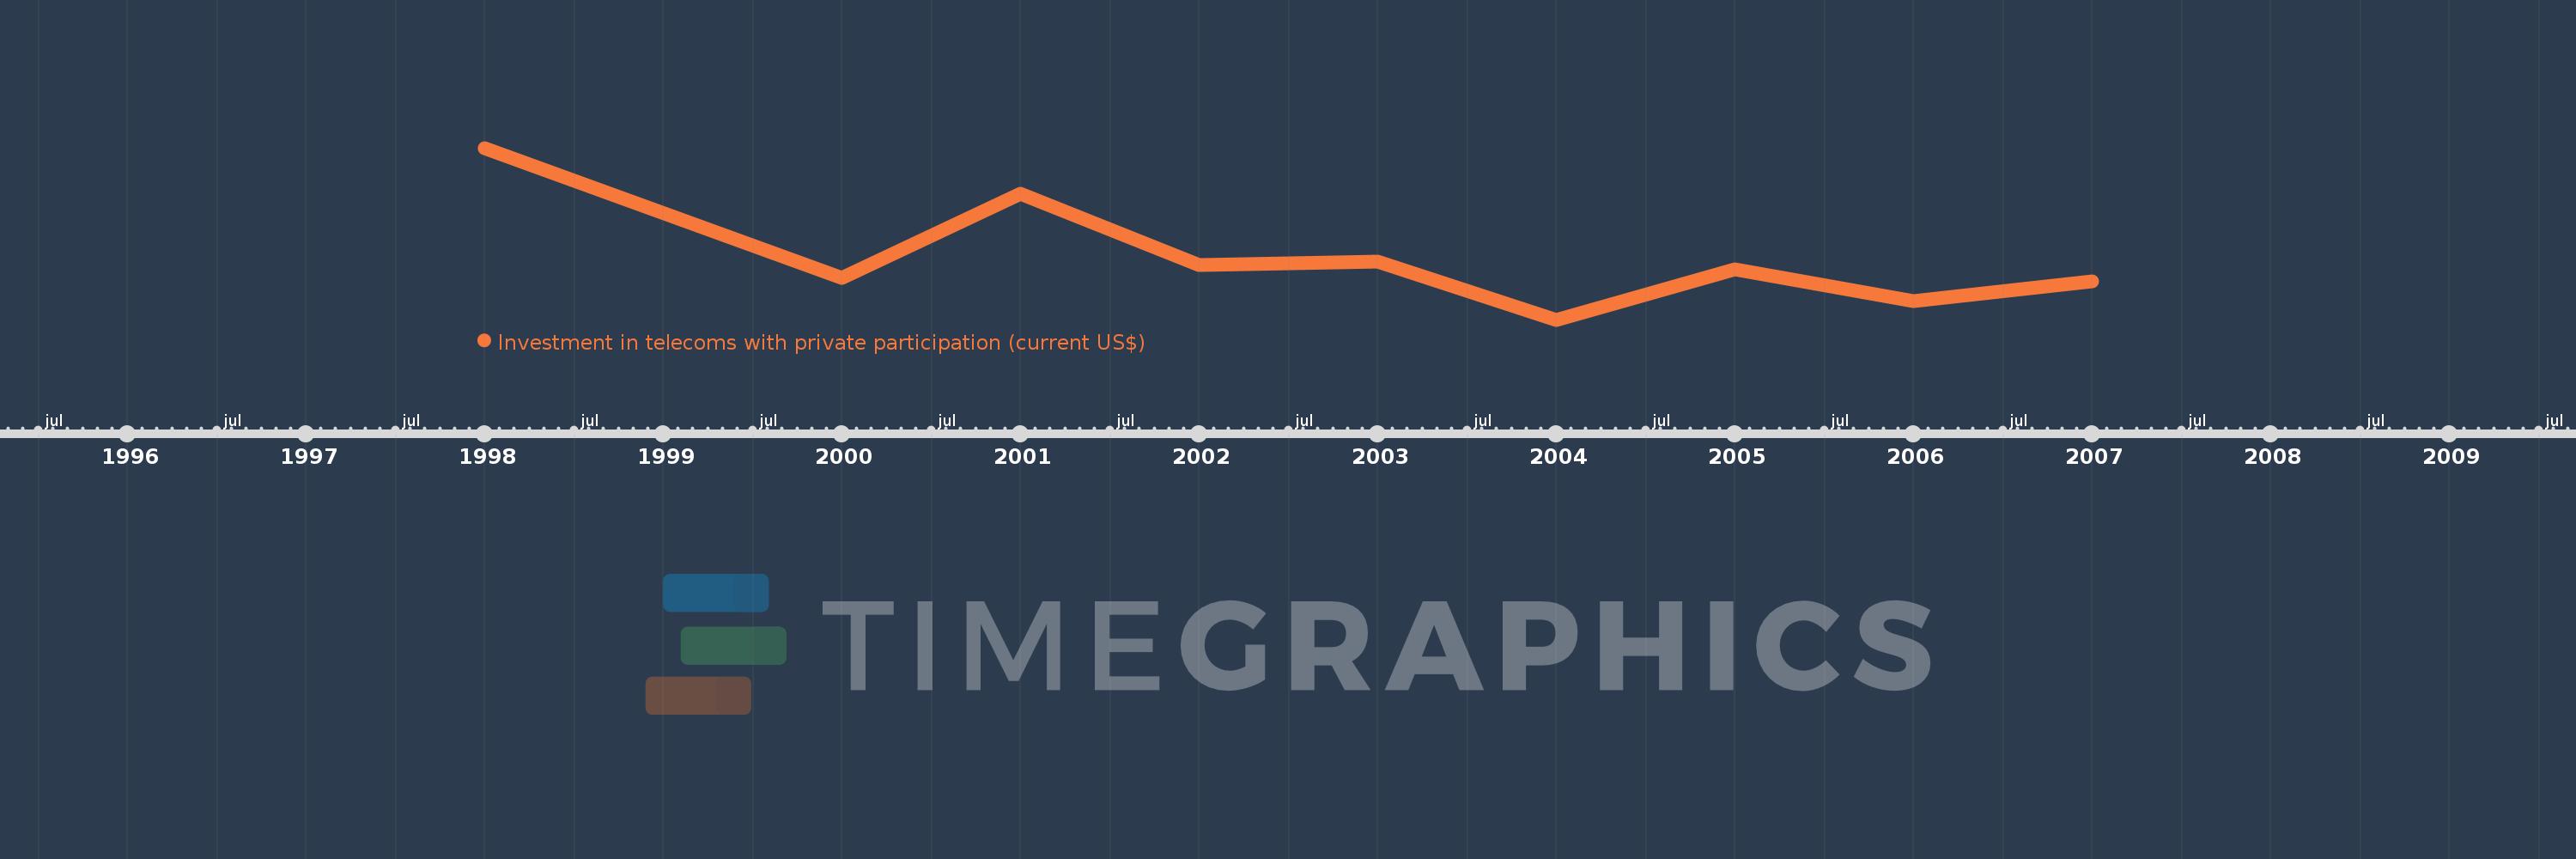
This timeline shows a graph from 1998 to 2007 of East Asia & Pacific (excluding high income). No data until 1997. Number of actual observations by date: 9.
Source name:
World Development Indicators
Source organization:
World Bank, Private Participation in Infrastructure Project Database (http://ppi.worldbank.org).
Categories, topics:
Infrastructure, Private Sector
Last updated:
apr 23, 2017
Indicators value changes by year
Meaning:
5.322 bln
Minimum:
3.077 bln
jan 1, 2004
Maximum:
9.289 bln
jan 1, 1998
At the date of observation
Value
Absolute change
Change from the previous value
jan 1, 1998
9.289 bln
+9.289 bln
0.0%
jan 1, 2000
4.581 bln
-4.708 bln
-50.68%
jan 1, 2001
7.619 bln
+3.038 bln
66.31%
jan 1, 2002
5.043 bln
-2.576 bln
-33.82%
jan 1, 2003
5.191 bln
+148.14 mln
2.94%
jan 1, 2004
3.077 bln
-2.114 bln
-40.73%
jan 1, 2005
4.906 bln
+1.829 bln
59.46%
jan 1, 2006
3.74 bln
-1.166 bln
-23.77%
jan 1, 2007
4.457 bln
+716.4 mln
19.15%
Ranking of countries by current statistics by years
