29
/
en
AIzaSyAYiBZKx7MnpbEhh9jyipgxe19OcubqV5w
April 1, 2024
31738
Europe & Central Asia (excluding high income)
ECA
false
2
1
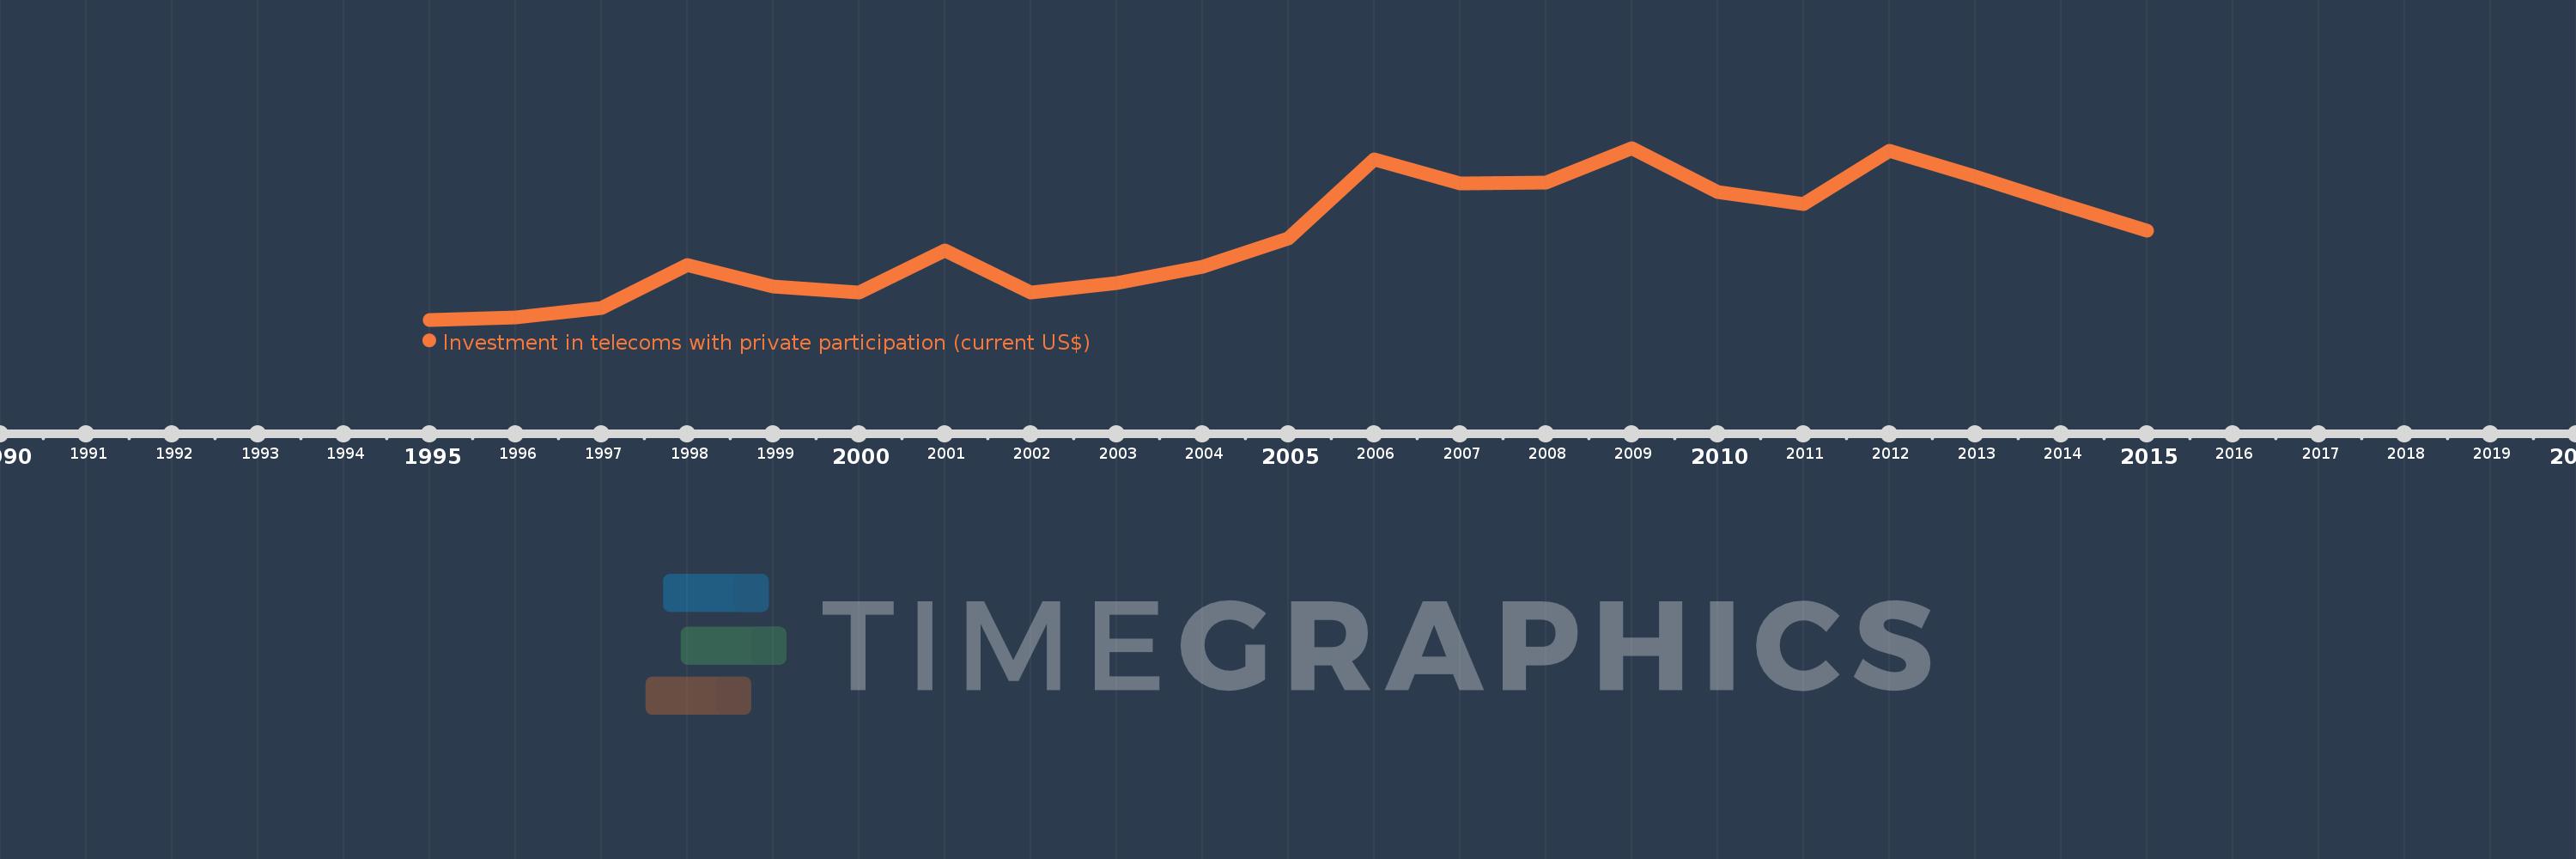
Investment in telecoms with private participation (current US$)
2015,2014,2013,2012,2011,2010,2009,2008,2007,2006,2005,2004,2003,2002,2001,2000,1999,1998,1997,1996,1995
This statistics in other country:
AfghanistanAlbaniaAlgeriaAmerican SamoaAngolaAntigua and BarbudaArgentinaArmeniaAzerbaijanBangladeshBelarusBelizeBeninBhutanBoliviaBosnia and HerzegovinaBotswanaBrazilBulgariaBurkina FasoBurundiCabo VerdeCambodiaCameroonCentral African RepublicChadChileChinaColombiaCongo, Dem. Rep.Congo, Rep.Costa RicaCote d'IvoireCubaDominicaDominican RepublicEarly-demographic dividendEast Asia & Pacific (excluding high income)East Asia & Pacific (IDA & IBRD countries)EcuadorEgypt, Arab Rep.El SalvadorEritreaEthiopiaEurope & Central Asia (excluding high income)Europe & Central Asia (IDA & IBRD countries)FijiFragile and conflict affected situationsGabonGambia, TheGeorgiaGhanaGrenadaGuatemalaGuineaGuinea-BissauGuyanaHaitiHeavily indebted poor countries (HIPC)HondurasIBRD onlyIDA & IBRD totalIDA blendIDA onlyIDA totalIndiaIndonesiaIran, Islamic Rep.IraqJamaicaJordanKazakhstanKenyaKiribatiKorea, Dem. People’s Rep.KosovoKyrgyz RepublicLao PDRLate-demographic dividendLatin America & Caribbean Latin America & Caribbean (excluding high income)Latin America & the Caribbean (IDA & IBRD countries)Least developed countries: UN classificationLebanonLesothoLiberiaLithuaniaLow & middle incomeLow incomeLower middle incomeMacedonia, FYRMadagascarMalawiMalaysiaMaldivesMaliMauritaniaMauritiusMexicoMicronesia, Fed. Sts.Middle East & North Africa (excluding high income)Middle East & North Africa (IDA & IBRD countries)Middle incomeMoldovaMongoliaMontenegroMoroccoMozambiqueMyanmarNamibiaNepalNicaraguaNigerNigeriaOther small statesPacific island small statesPakistanPanamaPapua New GuineaParaguayPeruPhilippinesPre-demographic dividendRomaniaRussian FederationRwandaSamoaSenegalSerbiaSeychellesSierra LeoneSomaliaSouth AfricaSouth AsiaSouth Asia (IDA & IBRD)South SudanSri LankaSt. Kitts and NevisSt. LuciaSt. Vincent and the GrenadinesSub-Saharan Africa Sub-Saharan Africa (excluding high income)Sub-Saharan Africa (IDA & IBRD countries)SudanSurinameSwazilandSyrian Arab RepublicTajikistanTanzaniaThailandTimor-LesteTogoTongaTunisiaTurkeyTurkmenistanUgandaUkraineUpper middle incomeUruguayUzbekistanVanuatuVenezuela, RBVietnamWest Bank and GazaYemen, Rep.ZambiaZimbabwe Timeline:
This timeline shows a graph from 1995 to 2015 of Europe & Central Asia (excluding high income). No data until 1994. Number of actual observations by date: 21.
Source name:
World Development Indicators
Source organization:
World Bank, Private Participation in Infrastructure Project Database (http://ppi.worldbank.org).
Categories, topics:
Infrastructure, Private Sector
Last updated:
apr 23, 2017
Indicators value changes by year
Minimum:
503.8 mln
jan 1, 1995
Maximum:
18.677 bln
jan 1, 2009
At the date of observation
Value
Absolute change
Change from previous value
jan 1, 1995
503.8 mln
+503.8 mln
0.0%
jan 1, 1996
724.2 mln
+220.4 mln
43.75%
jan 1, 1997
1.781 bln
+1.057 bln
145.98%
jan 1, 1998
6.295 bln
+4.514 bln
253.38%
jan 1, 1999
4.006 bln
-2.289 bln
-36.37%
jan 1, 2000
3.362 bln
-643.8 mln
-16.07%
jan 1, 2001
7.827 bln
+4.465 bln
132.82%
jan 1, 2002
3.401 bln
-4.426 bln
-56.55%
jan 1, 2003
4.358 bln
+956.919 mln
28.14%
jan 1, 2004
6.133 bln
+1.776 bln
40.75%
jan 1, 2005
9.154 bln
+3.02 bln
49.25%
jan 1, 2006
17.475 bln
+8.321 bln
90.91%
jan 1, 2007
14.891 bln
-2.584 bln
-14.79%
jan 1, 2008
15.015 bln
+124.078 mln
0.83%
jan 1, 2009
18.677 bln
+3.662 bln
24.39%
jan 1, 2010
13.976 bln
-4.701 bln
-25.17%
jan 1, 2011
12.752 bln
-1.224 bln
-8.76%
jan 1, 2012
18.343 bln
+5.591 bln
43.84%
jan 1, 2013
15.696 bln
-2.647 bln
-14.43%
jan 1, 2014
12.72 bln
-2.976 bln
-18.96%
jan 1, 2015
9.967 bln
-2.753 bln
-21.64%
Ranking of countries by current statistics by years


Comments: