29
/
en
AIzaSyAYiBZKx7MnpbEhh9jyipgxe19OcubqV5w
April 1, 2024
37776
IDA & IBRD total
IBT
false
2
1
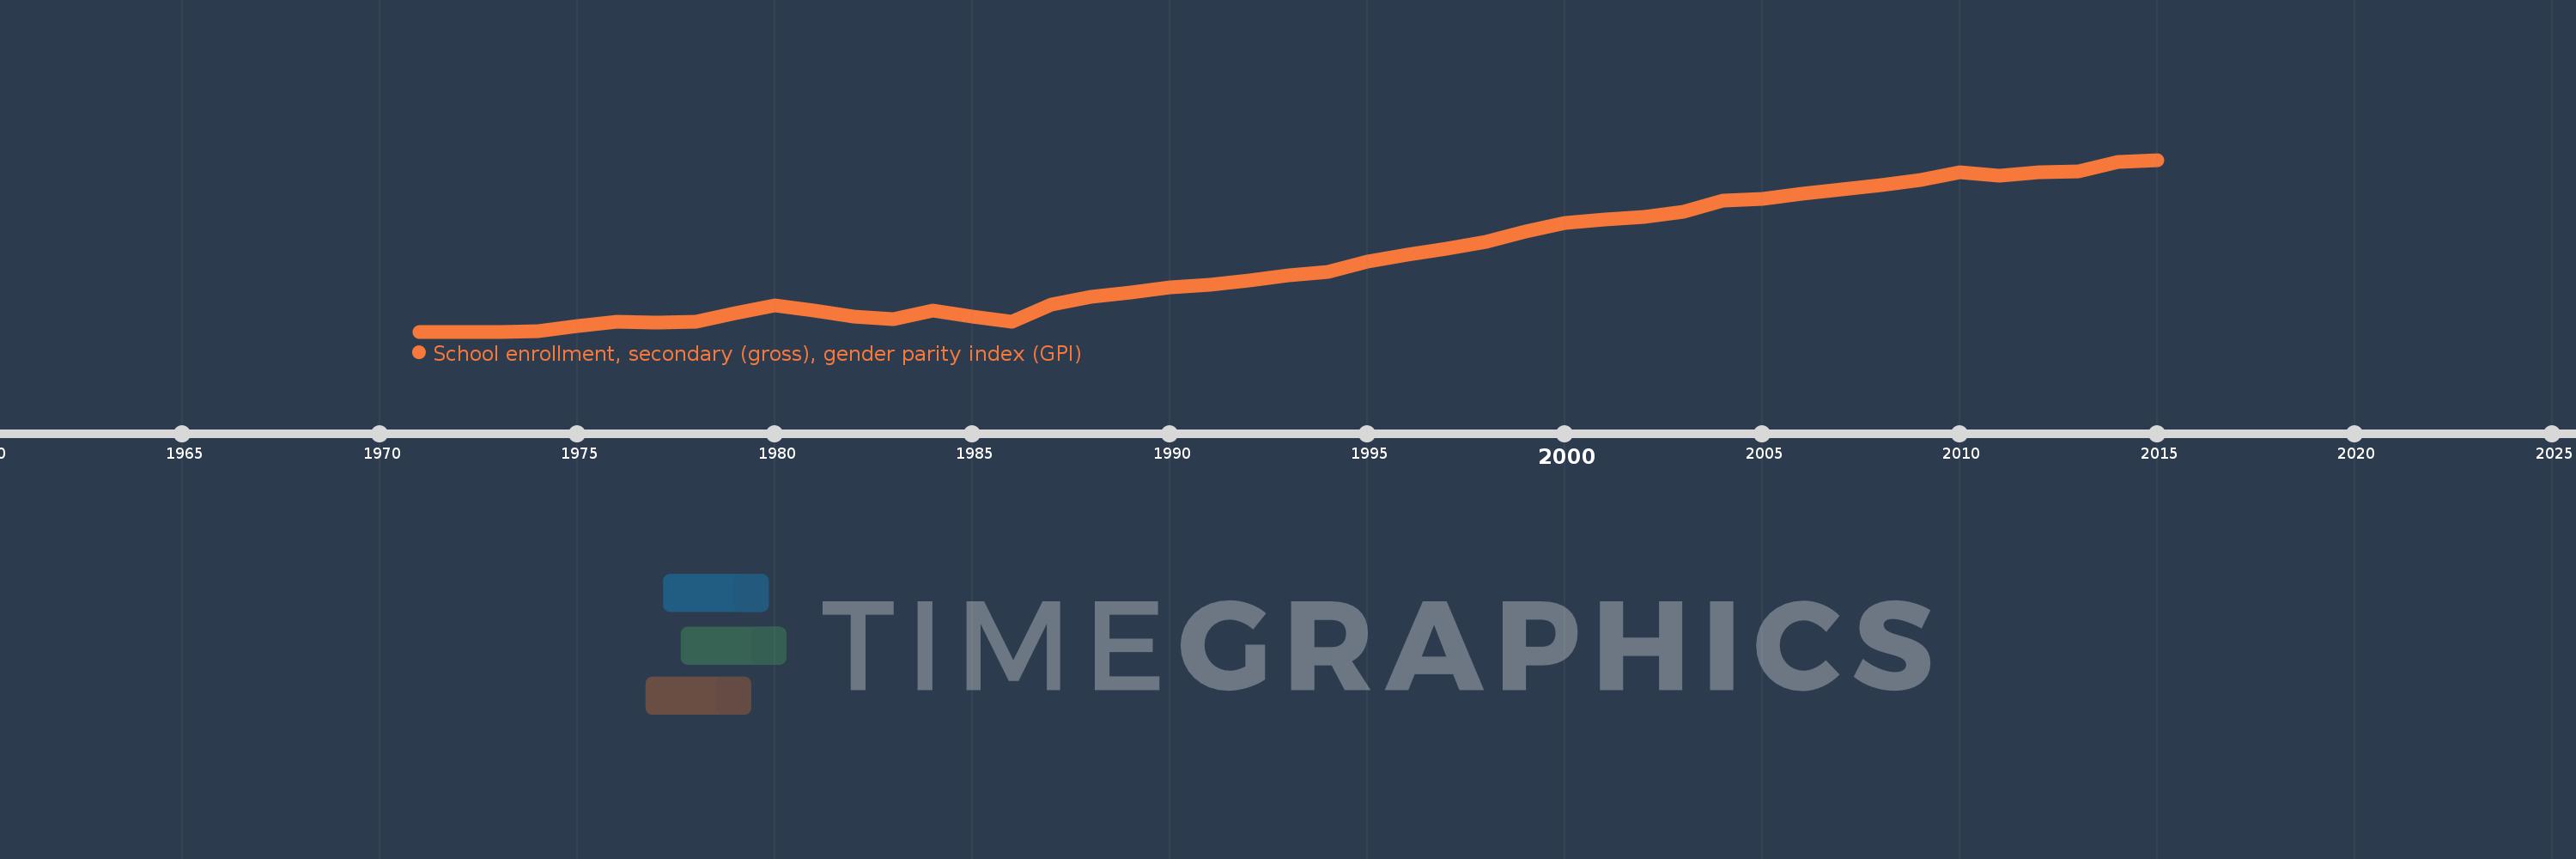
School enrollment, secondary (gross), gender parity index (GPI)
2015,2014,2013,2012,2011,2010,2009,2008,2007,2006,2005,2004,2003,2002,2001,2000,1999,1998,1997,1996,1995,1994,1993,1992,1991,1990,1989,1988,1987,1986,1985,1984,1983,1982,1981,1980,1979,1978,1977,1976,1975,1974,1973,1972,1971
This statistics in other country:
AfghanistanAlbaniaAlgeriaAndorraAngolaAntigua and BarbudaArab WorldArgentinaArmeniaArubaAustraliaAustriaAzerbaijanBahamas, TheBahrainBangladeshBarbadosBelarusBelgiumBelizeBeninBermudaBhutanBoliviaBosnia and HerzegovinaBotswanaBrazilBrunei DarussalamBulgariaBurkina FasoBurundiCabo VerdeCambodiaCameroonCanadaCaribbean small statesCentral African RepublicCentral Europe and the BalticsChadChileChinaColombiaComorosCongo, Dem. Rep.Congo, Rep.Costa RicaCote d'IvoireCroatiaCubaCuracaoCyprusCzech RepublicDenmarkDjiboutiDominicaDominican RepublicEarly-demographic dividendEast Asia & PacificEast Asia & Pacific (excluding high income)East Asia & Pacific (IDA & IBRD countries)EcuadorEgypt, Arab Rep.El SalvadorEquatorial GuineaEritreaEstoniaEthiopiaEuro areaEurope & Central AsiaEurope & Central Asia (excluding high income)Europe & Central Asia (IDA & IBRD countries)European UnionFijiFinlandFragile and conflict affected situationsFranceGabonGambia, TheGeorgiaGermanyGhanaGreeceGrenadaGuatemalaGuineaGuinea-BissauGuyanaHeavily indebted poor countries (HIPC)High incomeHondurasHong Kong SAR, ChinaHungaryIBRD onlyIcelandIDA & IBRD totalIDA blendIDA onlyIDA totalIndiaIndonesiaIran, Islamic Rep.IraqIrelandIsraelItalyJamaicaJapanJordanKazakhstanKenyaKiribatiKorea, Dem. People’s Rep.Korea, Rep.KuwaitKyrgyz RepublicLao PDRLate-demographic dividendLatin America & Caribbean Latin America & Caribbean (excluding high income)Latin America & the Caribbean (IDA & IBRD countries)LatviaLeast developed countries: UN classificationLebanonLesothoLiberiaLibyaLiechtensteinLithuaniaLow & middle incomeLow incomeLower middle incomeLuxembourgMacao SAR, ChinaMacedonia, FYRMadagascarMalawiMaldivesMaliMaltaMarshall IslandsMauritaniaMauritiusMexicoMicronesia, Fed. Sts.Middle East & North AfricaMiddle East & North Africa (excluding high income)Middle East & North Africa (IDA & IBRD countries)Middle incomeMoldovaMongoliaMontenegroMoroccoMozambiqueMyanmarNamibiaNauruNepalNetherlandsNew ZealandNicaraguaNigerNigeriaNorth AmericaNorwayOECD membersOmanOther small statesPacific island small statesPakistanPalauPanamaPapua New GuineaParaguayPeruPhilippinesPolandPortugalPost-demographic dividendPre-demographic dividendPuerto RicoQatarRomaniaRussian FederationRwandaSamoaSan MarinoSao Tome and PrincipeSaudi ArabiaSenegalSerbiaSeychellesSierra LeoneSlovak RepublicSloveniaSmall statesSolomon IslandsSomaliaSouth AfricaSouth AsiaSouth Asia (IDA & IBRD)SpainSri LankaSt. Kitts and NevisSt. LuciaSt. Vincent and the GrenadinesSub-Saharan Africa Sub-Saharan Africa (excluding high income)Sub-Saharan Africa (IDA & IBRD countries)SudanSurinameSwazilandSwedenSwitzerlandSyrian Arab RepublicTajikistanTanzaniaThailandTimor-LesteTogoTongaTrinidad and TobagoTunisiaTurkeyTurkmenistanTuvaluUgandaUkraineUnited Arab EmiratesUnited KingdomUnited StatesUpper middle incomeUruguayUzbekistanVanuatuVenezuela, RBVietnamWest Bank and GazaWorldYemen, Rep.ZambiaZimbabwe Timeline:
This timeline shows a graph from 1971 to 2015 of IDA & IBRD total. No data until 1970. Number of actual observations by date: 45.
Source name:
World Development Indicators
Source organization:
United Nations Educational, Scientific, and Cultural Organization (UNESCO) Institute for Statistics.
Categories, topics:
Education, Gender, Social Development
Last updated:
apr 23, 2017
Indicators value changes by year
At the date of observation
Value
Absolute change
Change from previous value
jan 1, 1971
0.729
+0.729
0.0%
jan 1, 1972
0.729
+0.0
0.05%
jan 1, 1973
0.729
+0.0
0.03%
jan 1, 1974
0.73
+0.001
0.12%
jan 1, 1975
0.737
+0.007
1.01%
jan 1, 1976
0.743
+0.005
0.74%
jan 1, 1977
0.742
-0.001
-0.13%
jan 1, 1978
0.744
+0.002
0.3%
jan 1, 1979
0.756
+0.012
1.61%
jan 1, 1980
0.768
+0.012
1.62%
jan 1, 1981
0.76
-0.009
-1.14%
jan 1, 1982
0.751
-0.009
-1.2%
jan 1, 1983
0.747
-0.004
-0.47%
jan 1, 1984
0.76
+0.013
1.7%
jan 1, 1985
0.751
-0.009
-1.21%
jan 1, 1986
0.743
-0.007
-0.97%
jan 1, 1987
0.769
+0.026
3.43%
jan 1, 1988
0.781
+0.012
1.54%
jan 1, 1989
0.787
+0.006
0.79%
jan 1, 1990
0.795
+0.008
1.02%
jan 1, 1991
0.798
+0.003
0.44%
jan 1, 1992
0.804
+0.006
0.76%
jan 1, 1993
0.812
+0.007
0.93%
jan 1, 1994
0.817
+0.005
0.65%
jan 1, 1995
0.833
+0.016
1.94%
jan 1, 1996
0.843
+0.01
1.19%
jan 1, 1997
0.851
+0.008
0.98%
jan 1, 1998
0.862
+0.011
1.25%
jan 1, 1999
0.877
+0.015
1.71%
jan 1, 2000
0.89
+0.013
1.48%
jan 1, 2001
0.895
+0.006
0.65%
jan 1, 2002
0.899
+0.003
0.37%
jan 1, 2003
0.906
+0.007
0.77%
jan 1, 2004
0.923
+0.017
1.87%
jan 1, 2005
0.925
+0.002
0.21%
jan 1, 2006
0.933
+0.009
0.96%
jan 1, 2007
0.939
+0.005
0.57%
jan 1, 2008
0.945
+0.007
0.7%
jan 1, 2009
0.953
+0.008
0.83%
jan 1, 2010
0.965
+0.011
1.21%
jan 1, 2011
0.959
-0.005
-0.56%
jan 1, 2012
0.964
+0.004
0.46%
jan 1, 2013
0.966
+0.003
0.29%
jan 1, 2014
0.98
+0.013
1.38%
jan 1, 2015
0.983
+0.003
0.34%
Ranking of countries by current statistics by years


Comments: