29
/
en
AIzaSyAYiBZKx7MnpbEhh9jyipgxe19OcubqV5w
April 1, 2024
53023
OECD members
OED
false
2
1
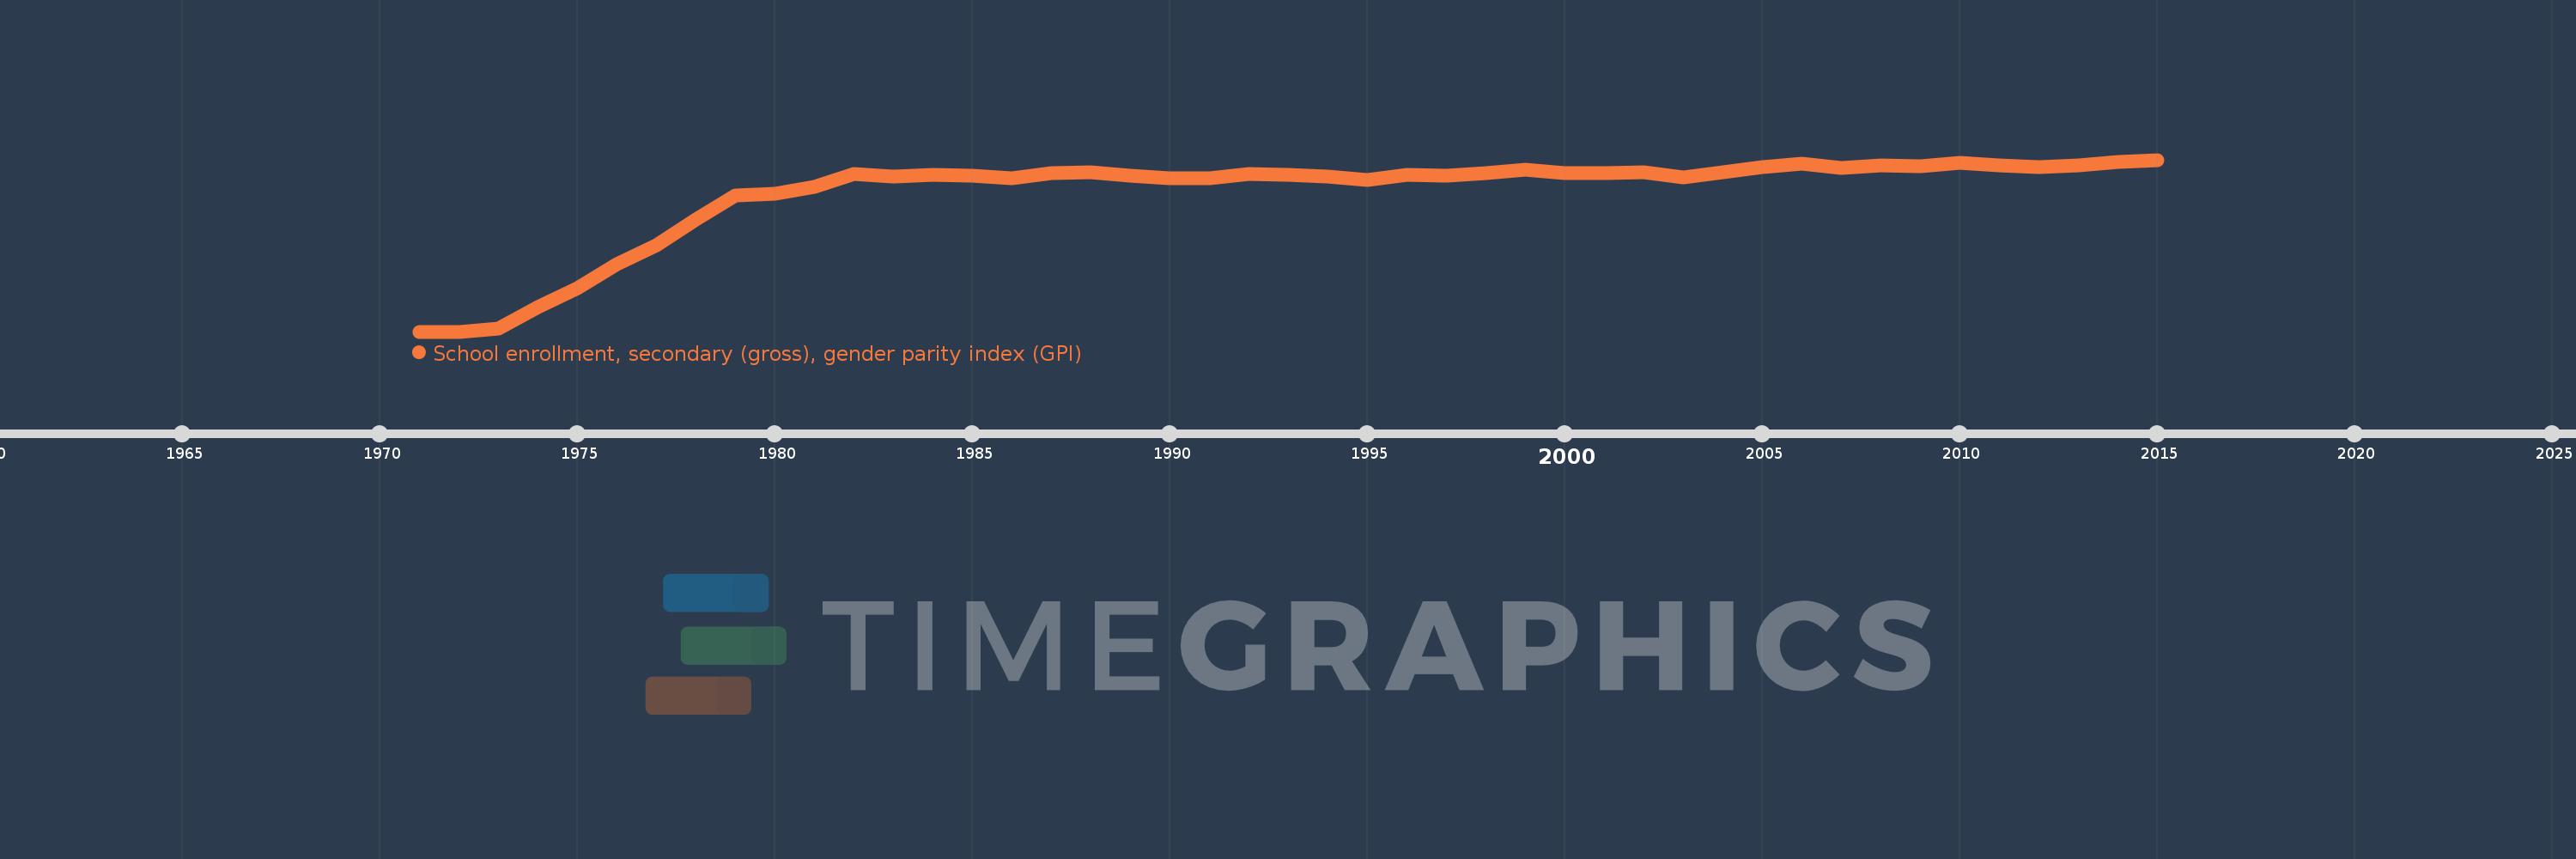
School enrollment, secondary (gross), gender parity index (GPI)
2015,2014,2013,2012,2011,2010,2009,2008,2007,2006,2005,2004,2003,2002,2001,2000,1999,1998,1997,1996,1995,1994,1993,1992,1991,1990,1989,1988,1987,1986,1985,1984,1983,1982,1981,1980,1979,1978,1977,1976,1975,1974,1973,1972,1971
This statistics in other country:
AfghanistanAlbaniaAlgeriaAndorraAngolaAntigua and BarbudaArab WorldArgentinaArmeniaArubaAustraliaAustriaAzerbaijanBahamas, TheBahrainBangladeshBarbadosBelarusBelgiumBelizeBeninBermudaBhutanBoliviaBosnia and HerzegovinaBotswanaBrazilBrunei DarussalamBulgariaBurkina FasoBurundiCabo VerdeCambodiaCameroonCanadaCaribbean small statesCentral African RepublicCentral Europe and the BalticsChadChileChinaColombiaComorosCongo, Dem. Rep.Congo, Rep.Costa RicaCote d'IvoireCroatiaCubaCuracaoCyprusCzech RepublicDenmarkDjiboutiDominicaDominican RepublicEarly-demographic dividendEast Asia & PacificEast Asia & Pacific (excluding high income)East Asia & Pacific (IDA & IBRD countries)EcuadorEgypt, Arab Rep.El SalvadorEquatorial GuineaEritreaEstoniaEthiopiaEuro areaEurope & Central AsiaEurope & Central Asia (excluding high income)Europe & Central Asia (IDA & IBRD countries)European UnionFijiFinlandFragile and conflict affected situationsFranceGabonGambia, TheGeorgiaGermanyGhanaGreeceGrenadaGuatemalaGuineaGuinea-BissauGuyanaHeavily indebted poor countries (HIPC)High incomeHondurasHong Kong SAR, ChinaHungaryIBRD onlyIcelandIDA & IBRD totalIDA blendIDA onlyIDA totalIndiaIndonesiaIran, Islamic Rep.IraqIrelandIsraelItalyJamaicaJapanJordanKazakhstanKenyaKiribatiKorea, Dem. People’s Rep.Korea, Rep.KuwaitKyrgyz RepublicLao PDRLate-demographic dividendLatin America & Caribbean Latin America & Caribbean (excluding high income)Latin America & the Caribbean (IDA & IBRD countries)LatviaLeast developed countries: UN classificationLebanonLesothoLiberiaLibyaLiechtensteinLithuaniaLow & middle incomeLow incomeLower middle incomeLuxembourgMacao SAR, ChinaMacedonia, FYRMadagascarMalawiMaldivesMaliMaltaMarshall IslandsMauritaniaMauritiusMexicoMicronesia, Fed. Sts.Middle East & North AfricaMiddle East & North Africa (excluding high income)Middle East & North Africa (IDA & IBRD countries)Middle incomeMoldovaMongoliaMontenegroMoroccoMozambiqueMyanmarNamibiaNauruNepalNetherlandsNew ZealandNicaraguaNigerNigeriaNorth AmericaNorwayOECD membersOmanOther small statesPacific island small statesPakistanPalauPanamaPapua New GuineaParaguayPeruPhilippinesPolandPortugalPost-demographic dividendPre-demographic dividendPuerto RicoQatarRomaniaRussian FederationRwandaSamoaSan MarinoSao Tome and PrincipeSaudi ArabiaSenegalSerbiaSeychellesSierra LeoneSlovak RepublicSloveniaSmall statesSolomon IslandsSomaliaSouth AfricaSouth AsiaSouth Asia (IDA & IBRD)SpainSri LankaSt. Kitts and NevisSt. LuciaSt. Vincent and the GrenadinesSub-Saharan Africa Sub-Saharan Africa (excluding high income)Sub-Saharan Africa (IDA & IBRD countries)SudanSurinameSwazilandSwedenSwitzerlandSyrian Arab RepublicTajikistanTanzaniaThailandTimor-LesteTogoTongaTrinidad and TobagoTunisiaTurkeyTurkmenistanTuvaluUgandaUkraineUnited Arab EmiratesUnited KingdomUnited StatesUpper middle incomeUruguayUzbekistanVanuatuVenezuela, RBVietnamWest Bank and GazaWorldYemen, Rep.ZambiaZimbabwe Timeline:
This timeline shows a graph from 1971 to 2015 of OECD members. No data until 1970. Number of actual observations by date: 45.
Source name:
World Development Indicators
Source organization:
United Nations Educational, Scientific, and Cultural Organization (UNESCO) Institute for Statistics.
Categories, topics:
Education, Gender, Social Development
Last updated:
apr 23, 2017
Indicators value changes by year
At the date of observation
Value
Absolute change
Change from previous value
jan 1, 1971
0.808
+0.808
0.0%
jan 1, 1972
0.808
+0.0
0.04%
jan 1, 1973
0.811
+0.003
0.31%
jan 1, 1974
0.836
+0.025
3.14%
jan 1, 1975
0.858
+0.021
2.57%
jan 1, 1976
0.886
+0.028
3.3%
jan 1, 1977
0.908
+0.022
2.49%
jan 1, 1978
0.938
+0.03
3.29%
jan 1, 1979
0.966
+0.027
2.93%
jan 1, 1980
0.968
+0.002
0.22%
jan 1, 1981
0.976
+0.008
0.87%
jan 1, 1982
0.991
+0.015
1.52%
jan 1, 1983
0.988
-0.003
-0.33%
jan 1, 1984
0.99
+0.003
0.28%
jan 1, 1985
0.989
-0.001
-0.1%
jan 1, 1986
0.986
-0.003
-0.35%
jan 1, 1987
0.992
+0.006
0.61%
jan 1, 1988
0.993
+0.001
0.1%
jan 1, 1989
0.989
-0.004
-0.37%
jan 1, 1990
0.986
-0.003
-0.27%
jan 1, 1991
0.986
0.0
-0.05%
jan 1, 1992
0.991
+0.005
0.53%
jan 1, 1993
0.99
-0.002
-0.18%
jan 1, 1994
0.988
-0.002
-0.17%
jan 1, 1995
0.984
-0.004
-0.37%
jan 1, 1996
0.99
+0.006
0.56%
jan 1, 1997
0.989
-0.001
-0.09%
jan 1, 1998
0.992
+0.003
0.31%
jan 1, 1999
0.996
+0.004
0.38%
jan 1, 2000
0.992
-0.004
-0.37%
jan 1, 2001
0.992
+0.0
0.02%
jan 1, 2002
0.993
+0.0
0.05%
jan 1, 2003
0.987
-0.006
-0.56%
jan 1, 2004
0.993
+0.006
0.58%
jan 1, 2005
0.999
+0.007
0.67%
jan 1, 2006
1.003
+0.003
0.33%
jan 1, 2007
0.998
-0.005
-0.49%
jan 1, 2008
1.001
+0.003
0.3%
jan 1, 2009
1.0
0.0
-0.04%
jan 1, 2010
1.004
+0.003
0.34%
jan 1, 2011
1.001
-0.003
-0.26%
jan 1, 2012
0.999
-0.003
-0.27%
jan 1, 2013
1.001
+0.002
0.21%
jan 1, 2014
1.005
+0.004
0.42%
jan 1, 2015
1.007
+0.002
0.22%
Ranking of countries by current statistics by years


Comments: