29
/
en
AIzaSyAYiBZKx7MnpbEhh9jyipgxe19OcubqV5w
April 1, 2024
120456
Djibouti
DJI
true
2
1
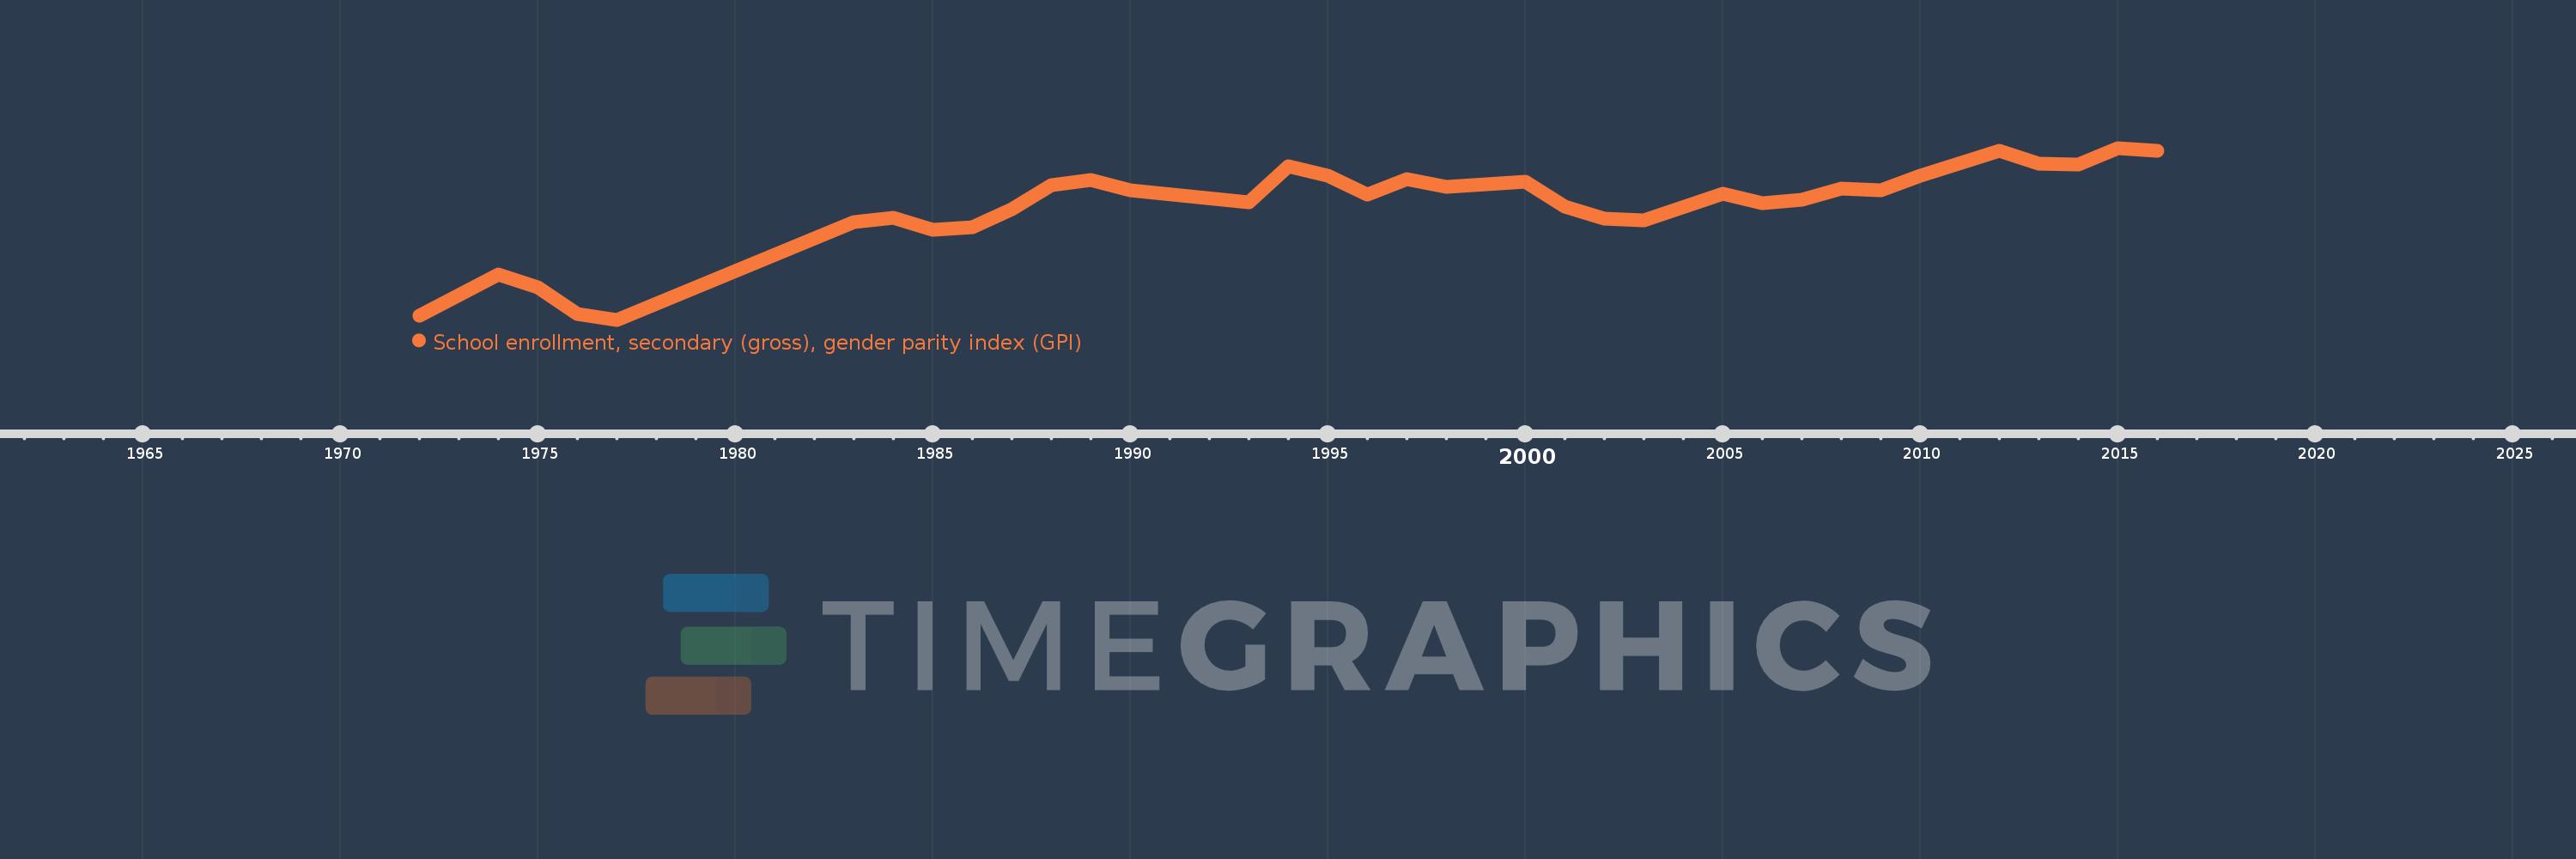
School enrollment, secondary (gross), gender parity index (GPI)
2016,2015,2014,2013,2012,2010,2009,2008,2007,2006,2005,2003,2002,2001,2000,1998,1997,1996,1995,1994,1993,1990,1989,1988,1987,1986,1985,1984,1983,1977,1976,1975,1974,1972
This statistics in other country:
AfghanistanAlbaniaAlgeriaAndorraAngolaAntigua and BarbudaArab WorldArgentinaArmeniaArubaAustraliaAustriaAzerbaijanBahamas, TheBahrainBangladeshBarbadosBelarusBelgiumBelizeBeninBermudaBhutanBoliviaBosnia and HerzegovinaBotswanaBrazilBrunei DarussalamBulgariaBurkina FasoBurundiCabo VerdeCambodiaCameroonCanadaCaribbean small statesCentral African RepublicCentral Europe and the BalticsChadChileChinaColombiaComorosCongo, Dem. Rep.Congo, Rep.Costa RicaCote d'IvoireCroatiaCubaCuracaoCyprusCzech RepublicDenmarkDjiboutiDominicaDominican RepublicEarly-demographic dividendEast Asia & PacificEast Asia & Pacific (excluding high income)East Asia & Pacific (IDA & IBRD countries)EcuadorEgypt, Arab Rep.El SalvadorEquatorial GuineaEritreaEstoniaEthiopiaEuro areaEurope & Central AsiaEurope & Central Asia (excluding high income)Europe & Central Asia (IDA & IBRD countries)European UnionFijiFinlandFragile and conflict affected situationsFranceGabonGambia, TheGeorgiaGermanyGhanaGreeceGrenadaGuatemalaGuineaGuinea-BissauGuyanaHeavily indebted poor countries (HIPC)High incomeHondurasHong Kong SAR, ChinaHungaryIBRD onlyIcelandIDA & IBRD totalIDA blendIDA onlyIDA totalIndiaIndonesiaIran, Islamic Rep.IraqIrelandIsraelItalyJamaicaJapanJordanKazakhstanKenyaKiribatiKorea, Dem. People’s Rep.Korea, Rep.KuwaitKyrgyz RepublicLao PDRLate-demographic dividendLatin America & Caribbean Latin America & Caribbean (excluding high income)Latin America & the Caribbean (IDA & IBRD countries)LatviaLeast developed countries: UN classificationLebanonLesothoLiberiaLibyaLiechtensteinLithuaniaLow & middle incomeLow incomeLower middle incomeLuxembourgMacao SAR, ChinaMacedonia, FYRMadagascarMalawiMaldivesMaliMaltaMarshall IslandsMauritaniaMauritiusMexicoMicronesia, Fed. Sts.Middle East & North AfricaMiddle East & North Africa (excluding high income)Middle East & North Africa (IDA & IBRD countries)Middle incomeMoldovaMongoliaMontenegroMoroccoMozambiqueMyanmarNamibiaNauruNepalNetherlandsNew ZealandNicaraguaNigerNigeriaNorth AmericaNorwayOECD membersOmanOther small statesPacific island small statesPakistanPalauPanamaPapua New GuineaParaguayPeruPhilippinesPolandPortugalPost-demographic dividendPre-demographic dividendPuerto RicoQatarRomaniaRussian FederationRwandaSamoaSan MarinoSao Tome and PrincipeSaudi ArabiaSenegalSerbiaSeychellesSierra LeoneSlovak RepublicSloveniaSmall statesSolomon IslandsSomaliaSouth AfricaSouth AsiaSouth Asia (IDA & IBRD)SpainSri LankaSt. Kitts and NevisSt. LuciaSt. Vincent and the GrenadinesSub-Saharan Africa Sub-Saharan Africa (excluding high income)Sub-Saharan Africa (IDA & IBRD countries)SudanSurinameSwazilandSwedenSwitzerlandSyrian Arab RepublicTajikistanTanzaniaThailandTimor-LesteTogoTongaTrinidad and TobagoTunisiaTurkeyTurkmenistanTuvaluUgandaUkraineUnited Arab EmiratesUnited KingdomUnited StatesUpper middle incomeUruguayUzbekistanVanuatuVenezuela, RBVietnamWest Bank and GazaWorldYemen, Rep.ZambiaZimbabwe Timeline:
This timeline shows a graph from 1972 to 2016 of Djibouti. No data until 1971. Number of actual observations by date: 34.
Source name:
World Development Indicators
Source organization:
United Nations Educational, Scientific, and Cultural Organization (UNESCO) Institute for Statistics.
Categories, topics:
Education, Gender, Social Development
Last updated:
apr 23, 2017
Indicators value changes by year
At the date of observation
Value
Absolute change
Change from previous value
jan 1, 1972
0.375
+0.375
0.0%
jan 1, 1974
0.482
+0.107
28.65%
jan 1, 1975
0.45
-0.033
-6.81%
jan 1, 1976
0.381
-0.068
-15.13%
jan 1, 1977
0.365
-0.016
-4.31%
jan 1, 1983
0.618
+0.253
69.28%
jan 1, 1984
0.629
+0.011
1.76%
jan 1, 1985
0.599
-0.03
-4.7%
jan 1, 1986
0.606
+0.006
1.06%
jan 1, 1987
0.652
+0.047
7.72%
jan 1, 1988
0.715
+0.063
9.62%
jan 1, 1989
0.728
+0.013
1.84%
jan 1, 1990
0.702
-0.026
-3.56%
jan 1, 1993
0.669
-0.033
-4.71%
jan 1, 1994
0.763
+0.094
14.05%
jan 1, 1995
0.74
-0.023
-2.99%
jan 1, 1996
0.691
-0.049
-6.67%
jan 1, 1997
0.731
+0.04
5.73%
jan 1, 1998
0.711
-0.019
-2.66%
jan 1, 2000
0.724
+0.013
1.8%
jan 1, 2001
0.659
-0.065
-8.93%
jan 1, 2002
0.627
-0.033
-4.99%
jan 1, 2003
0.623
-0.004
-0.57%
jan 1, 2005
0.692
+0.069
11.14%
jan 1, 2006
0.667
-0.025
-3.62%
jan 1, 2007
0.676
+0.009
1.3%
jan 1, 2008
0.706
+0.03
4.39%
jan 1, 2009
0.702
-0.004
-0.5%
jan 1, 2010
0.738
+0.036
5.09%
jan 1, 2012
0.803
+0.065
8.84%
jan 1, 2013
0.771
-0.032
-4.02%
jan 1, 2014
0.769
-0.001
-0.19%
jan 1, 2015
0.811
+0.042
5.41%
jan 1, 2016
0.804
-0.007
-0.86%
Ranking of countries by current statistics by years


Comments: