29
/
en
AIzaSyAYiBZKx7MnpbEhh9jyipgxe19OcubqV5w
April 1, 2024
35888
High income
HIC
false
2
1
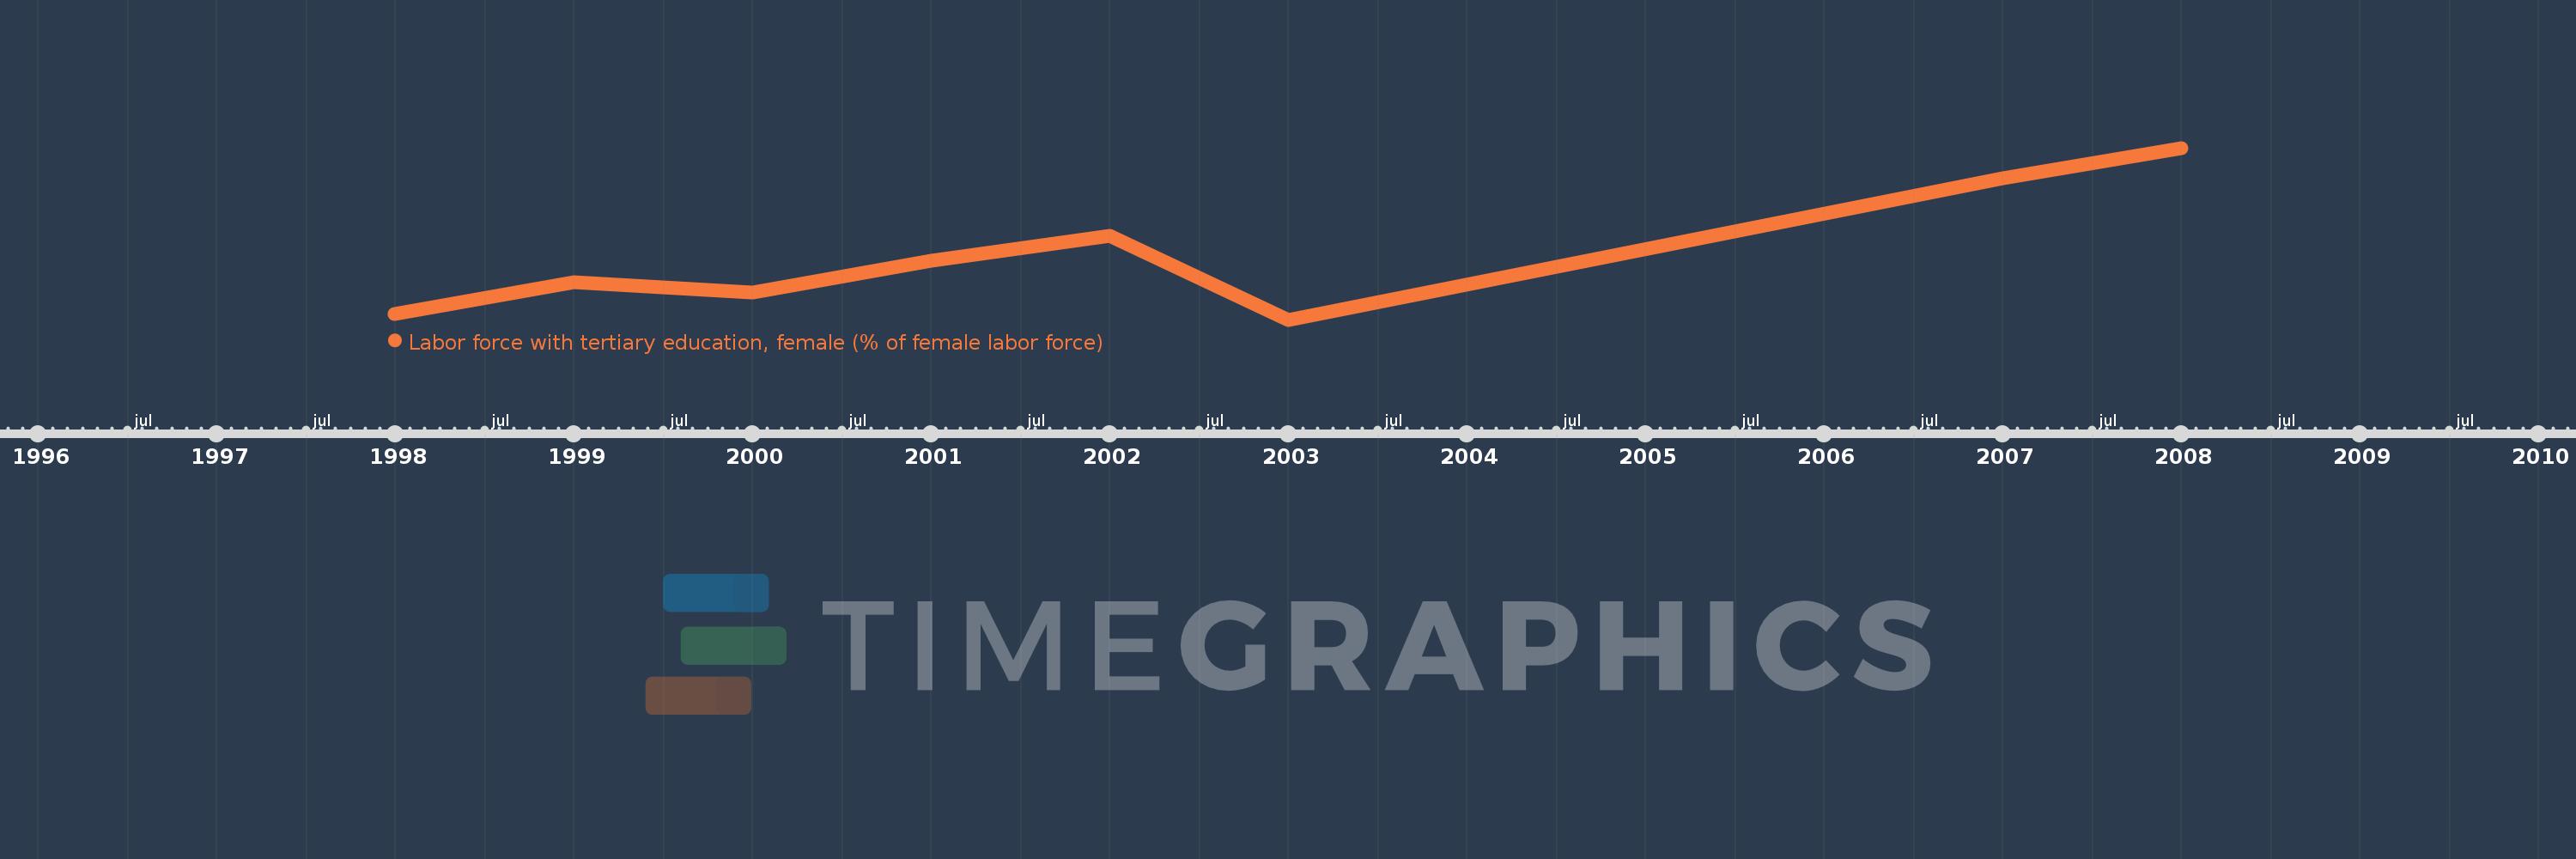
Labor force with tertiary education, female (% of female labor force)
2008,2007,2003,2002,2001,2000,1999,1998
This statistics in other country:
Timeline:
This timeline shows a graph from 1998 to 2008 of High income. No data until 1997. Number of actual observations by date: 8.
Source name:
World Development Indicators
Source organization:
International Labour Organization, Key Indicators of the Labour Market database.
Categories, topics:
Education, Social Protection & Labor, Gender
Last updated:
apr 23, 2017
Indicators value changes by year
Minimum:
27.079
jan 1, 2003
Maximum:
31.872
jan 1, 2008
At the date of observation
Value
Absolute change
Change from previous value
jan 1, 1998
27.247
+27.247
0.0%
jan 1, 1999
28.137
+0.891
3.27%
jan 1, 2000
27.834
-0.304
-1.08%
jan 1, 2001
28.726
+0.892
3.21%
jan 1, 2002
29.43
+0.704
2.45%
jan 1, 2003
27.079
-2.351
-7.99%
jan 1, 2007
31.036
+3.957
14.61%
jan 1, 2008
31.872
+0.836
2.69%
Ranking of countries by current statistics by years


Comments: