29
/
en
AIzaSyAYiBZKx7MnpbEhh9jyipgxe19OcubqV5w
April 1, 2024
32761
Europe & Central Asia (IDA & IBRD countries)
TEC
false
2
1
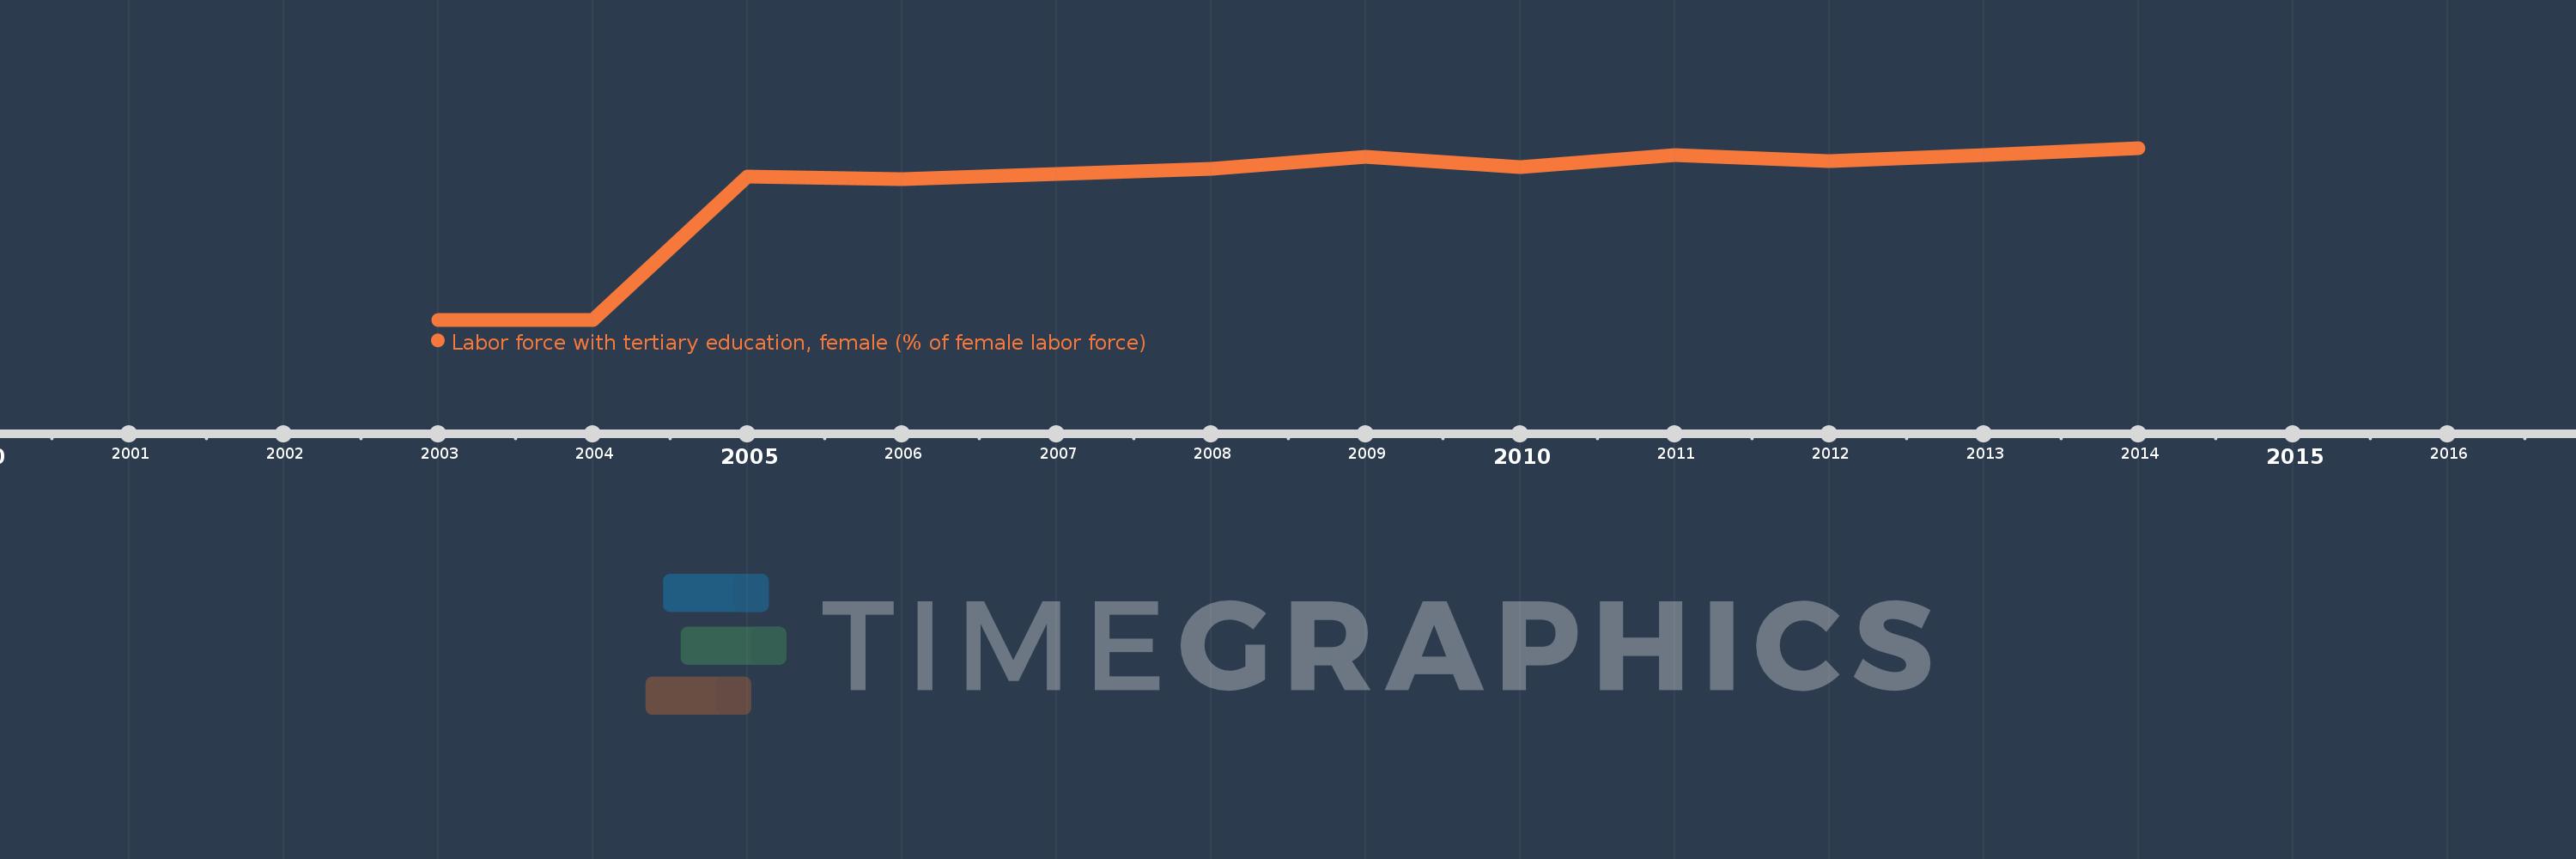
Labor force with tertiary education, female (% of female labor force)
2014,2013,2012,2011,2010,2009,2008,2007,2006,2005,2004,2003
This statistics in other country:
Timeline:
This timeline shows a graph from 2003 to 2014 of Europe & Central Asia (IDA & IBRD countries). No data until 2002. Number of actual observations by date: 12.
Source name:
World Development Indicators
Source organization:
International Labour Organization, Key Indicators of the Labour Market database.
Categories, topics:
Education, Social Protection & Labor, Gender
Last updated:
apr 23, 2017
Indicators value changes by year
Minimum:
24.647
jan 1, 2003
Maximum:
47.493
jan 1, 2014
At the date of observation
Value
Absolute change
Change from previous value
jan 1, 2003
24.647
+24.647
0.0%
jan 1, 2004
24.652
+0.005
0.02%
jan 1, 2005
43.672
+19.02
77.15%
jan 1, 2006
43.348
-0.324
-0.74%
jan 1, 2007
44.081
+0.733
1.69%
jan 1, 2008
44.733
+0.652
1.48%
jan 1, 2009
46.289
+1.556
3.48%
jan 1, 2010
44.983
-1.307
-2.82%
jan 1, 2011
46.52
+1.537
3.42%
jan 1, 2012
45.697
-0.823
-1.77%
jan 1, 2013
46.52
+0.824
1.8%
jan 1, 2014
47.493
+0.972
2.09%
Ranking of countries by current statistics by years


Comments: