29
/
en
AIzaSyAYiBZKx7MnpbEhh9jyipgxe19OcubqV5w
April 1, 2024
42562
Latin America & Caribbean (excluding high income)
LAC
false
2
1
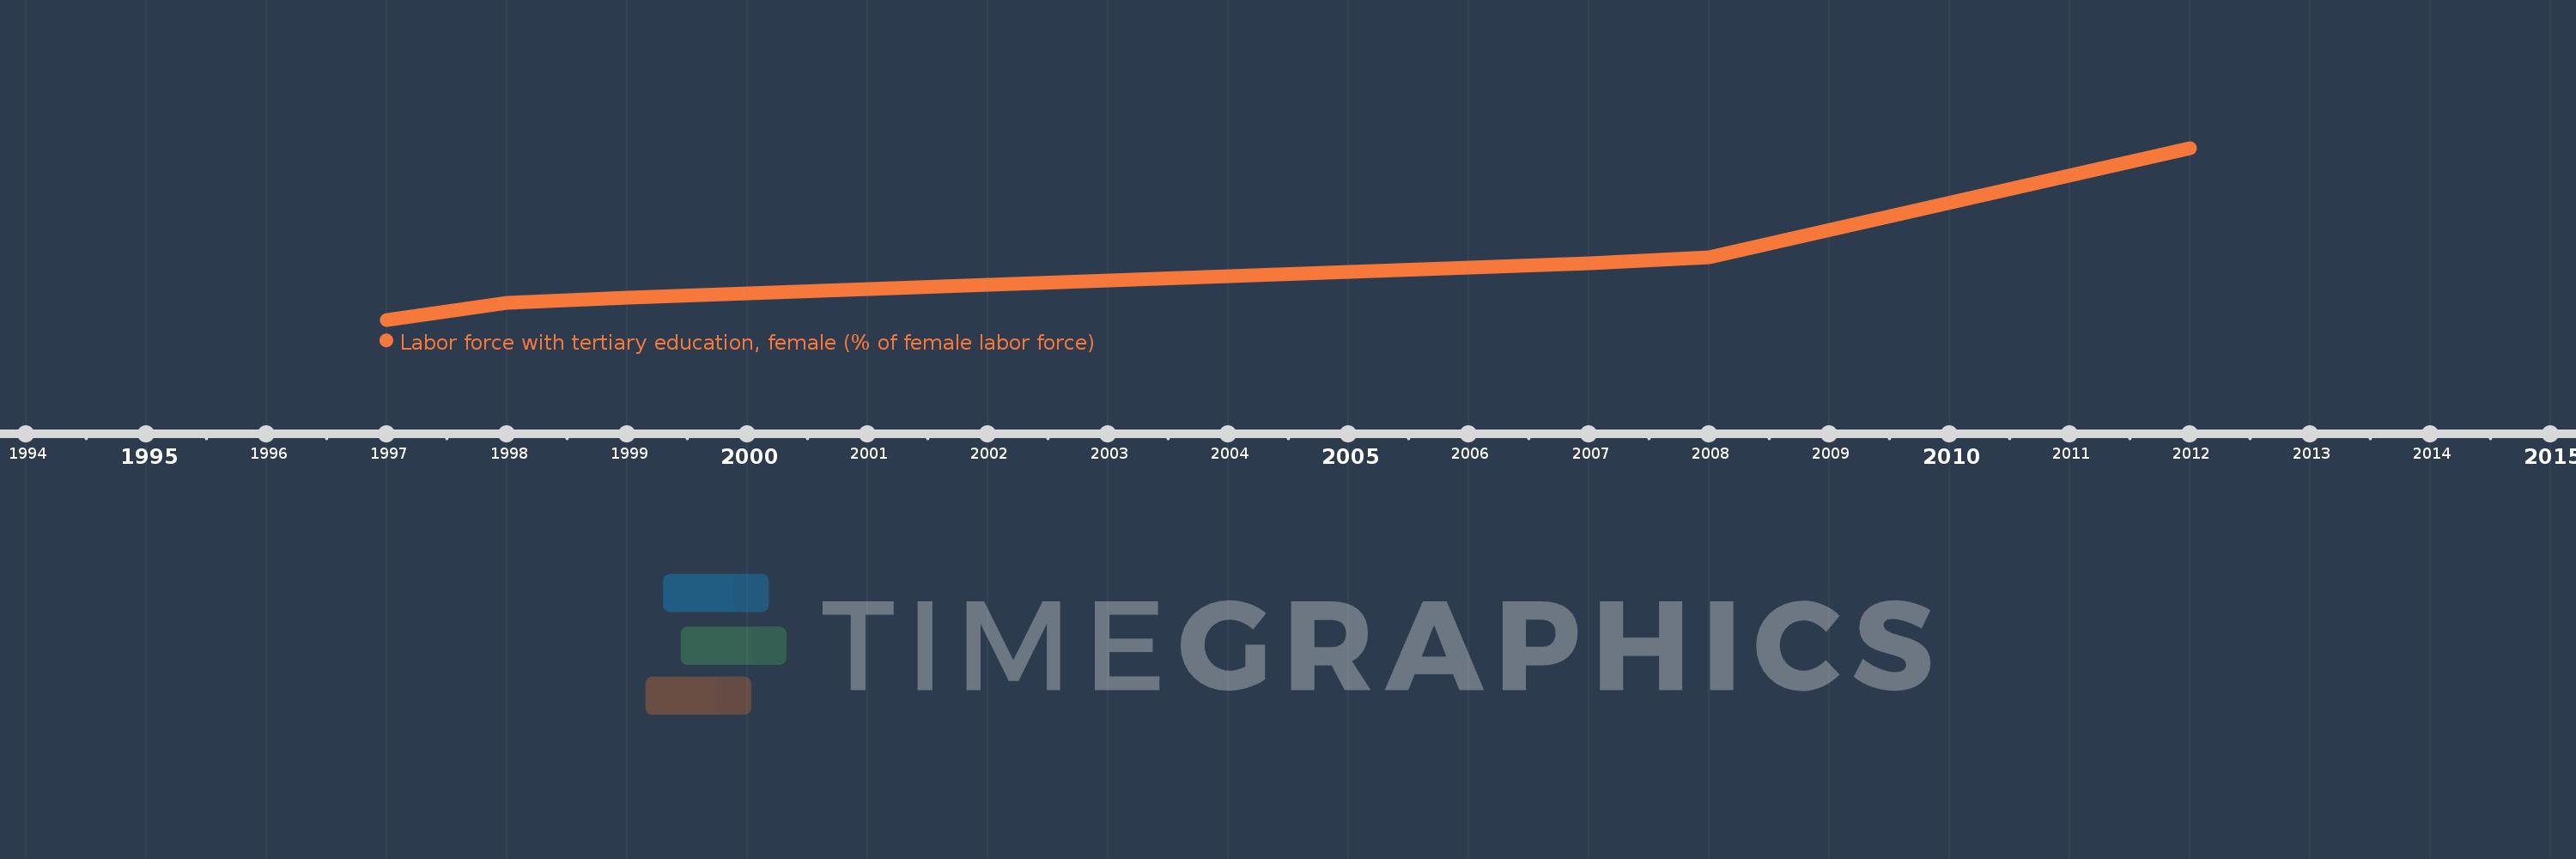
Labor force with tertiary education, female (% of female labor force)
2012,2008,2007,1999,1998,1997
This statistics in other country:
Timeline:
This timeline shows a graph from 1997 to 2012 of Latin America & Caribbean (excluding high income). No data until 1996. Number of actual observations by date: 6.
Source name:
World Development Indicators
Source organization:
International Labour Organization, Key Indicators of the Labour Market database.
Categories, topics:
Education, Social Protection & Labor, Gender
Last updated:
apr 23, 2017
Indicators value changes by year
Minimum:
12.012
jan 1, 1997
Maximum:
25.008
jan 1, 2012
At the date of observation
Value
Absolute change
Change from previous value
jan 1, 1997
12.012
+12.012
0.0%
jan 1, 1998
13.261
+1.249
10.4%
jan 1, 1999
13.664
+0.402
3.03%
jan 1, 2007
16.308
+2.645
19.36%
jan 1, 2008
16.719
+0.41
2.52%
jan 1, 2012
25.008
+8.29
49.58%
Ranking of countries by current statistics by years


Comments: