29
/
en
AIzaSyAYiBZKx7MnpbEhh9jyipgxe19OcubqV5w
April 1, 2024
32304
Europe & Central Asia (excluding high income)
ECA
false
2
1
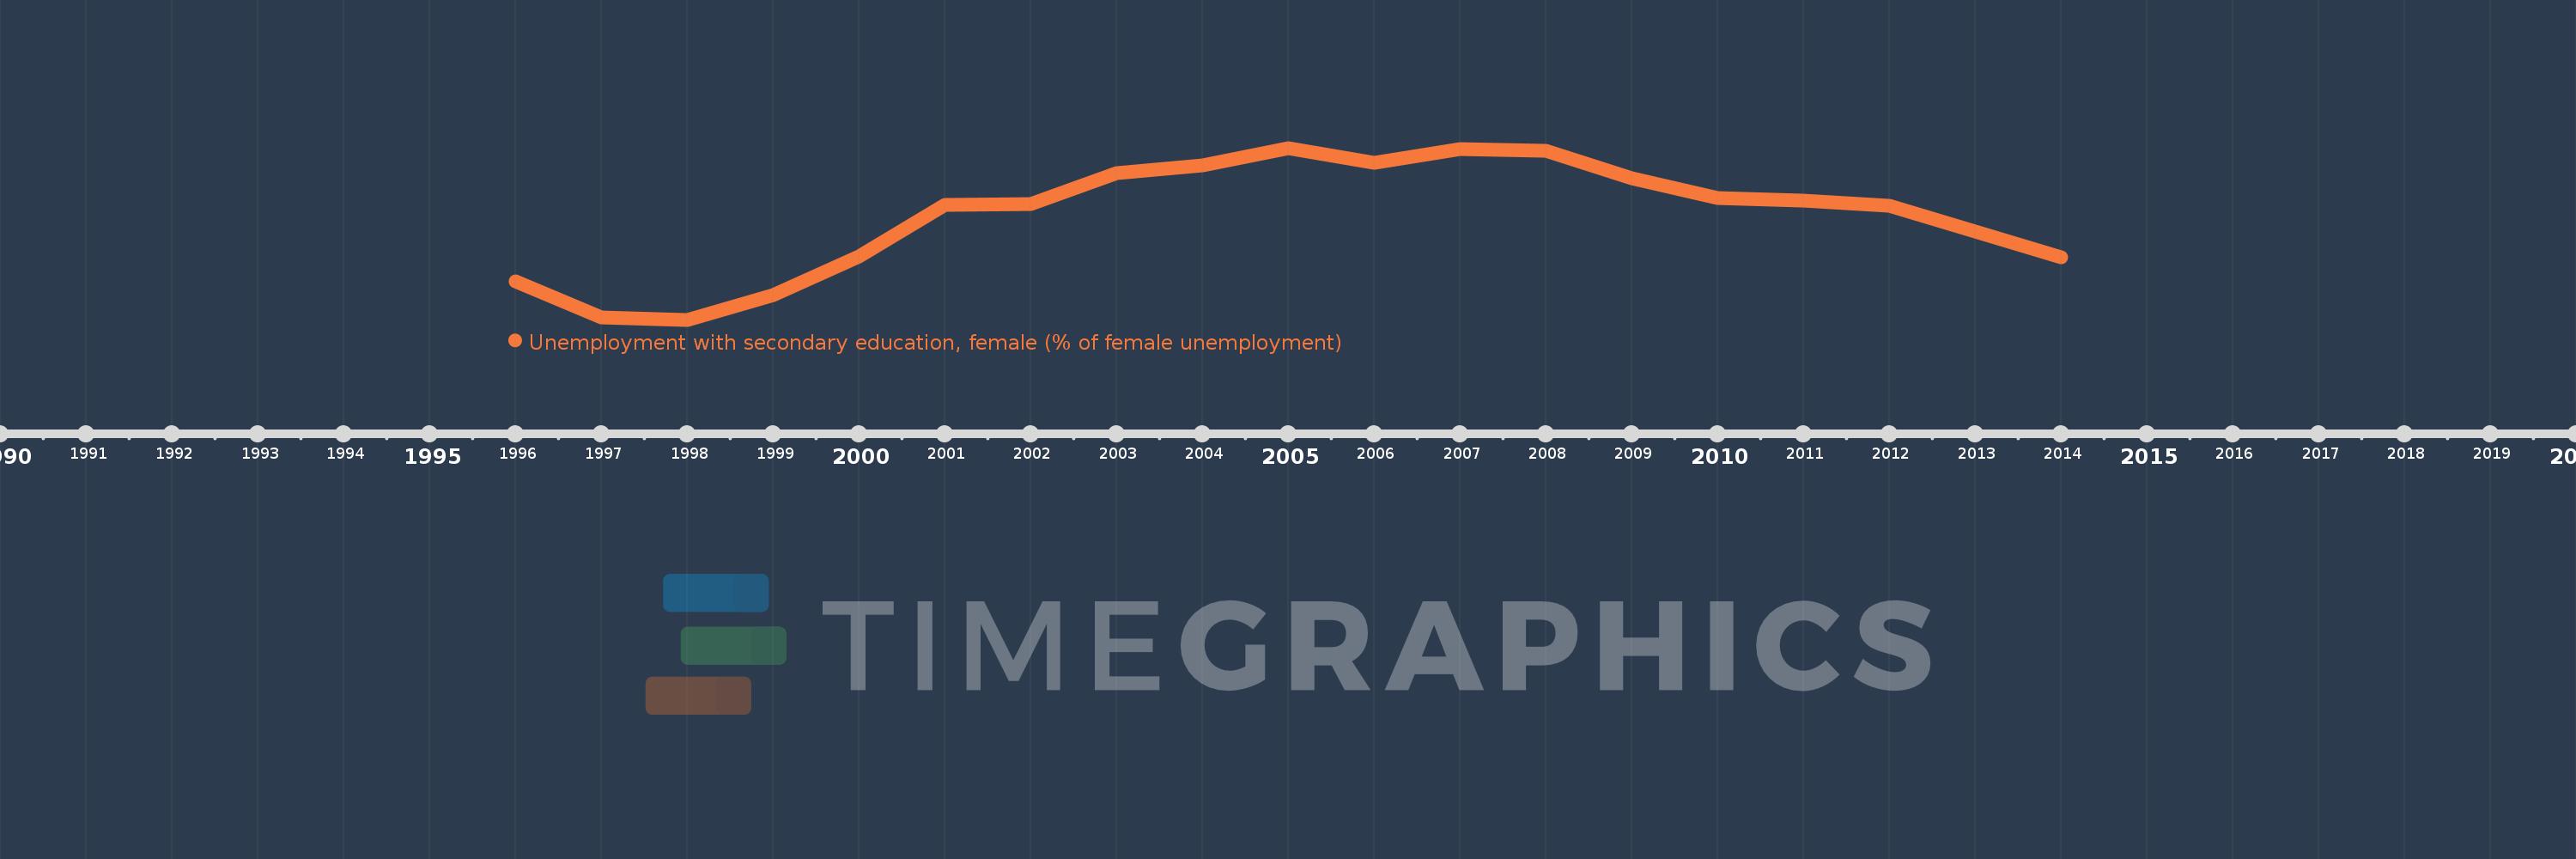
Unemployment with secondary education, female (% of female unemployment)
2014,2012,2011,2010,2009,2008,2007,2006,2005,2004,2003,2002,2001,2000,1999,1998,1997,1996
This statistics in other country:
Timeline:
This timeline shows a graph from 1996 to 2014 of Europe & Central Asia (excluding high income). No data until 1995. Number of actual observations by date: 18.
Source name:
World Development Indicators
Source organization:
International Labour Organization, Key Indicators of the Labour Market database.
Categories, topics:
Social Protection & Labor, Gender
Last updated:
apr 23, 2017
Indicators value changes by year
Minimum:
39.599
jan 1, 1998
Maximum:
50.045
jan 1, 2005
At the date of observation
Value
Absolute change
Change from previous value
jan 1, 1996
41.943
+41.943
0.0%
jan 1, 1997
39.721
-2.222
-5.3%
jan 1, 1998
39.599
-0.122
-0.31%
jan 1, 1999
41.087
+1.488
3.76%
jan 1, 2000
43.452
+2.365
5.76%
jan 1, 2001
46.574
+3.122
7.18%
jan 1, 2002
46.624
+0.05
0.11%
jan 1, 2003
48.495
+1.871
4.01%
jan 1, 2004
49.005
+0.509
1.05%
jan 1, 2005
50.045
+1.04
2.12%
jan 1, 2006
49.147
-0.898
-1.79%
jan 1, 2007
49.979
+0.832
1.69%
jan 1, 2008
49.862
-0.117
-0.23%
jan 1, 2009
48.199
-1.662
-3.33%
jan 1, 2010
46.977
-1.222
-2.54%
jan 1, 2011
46.837
-0.141
-0.3%
jan 1, 2012
46.522
-0.314
-0.67%
jan 1, 2014
43.409
-3.113
-6.69%
Ranking of countries by current statistics by years


Comments: