29
/
en
AIzaSyAYiBZKx7MnpbEhh9jyipgxe19OcubqV5w
April 1, 2024
33960
European Union
EUU
false
2
1
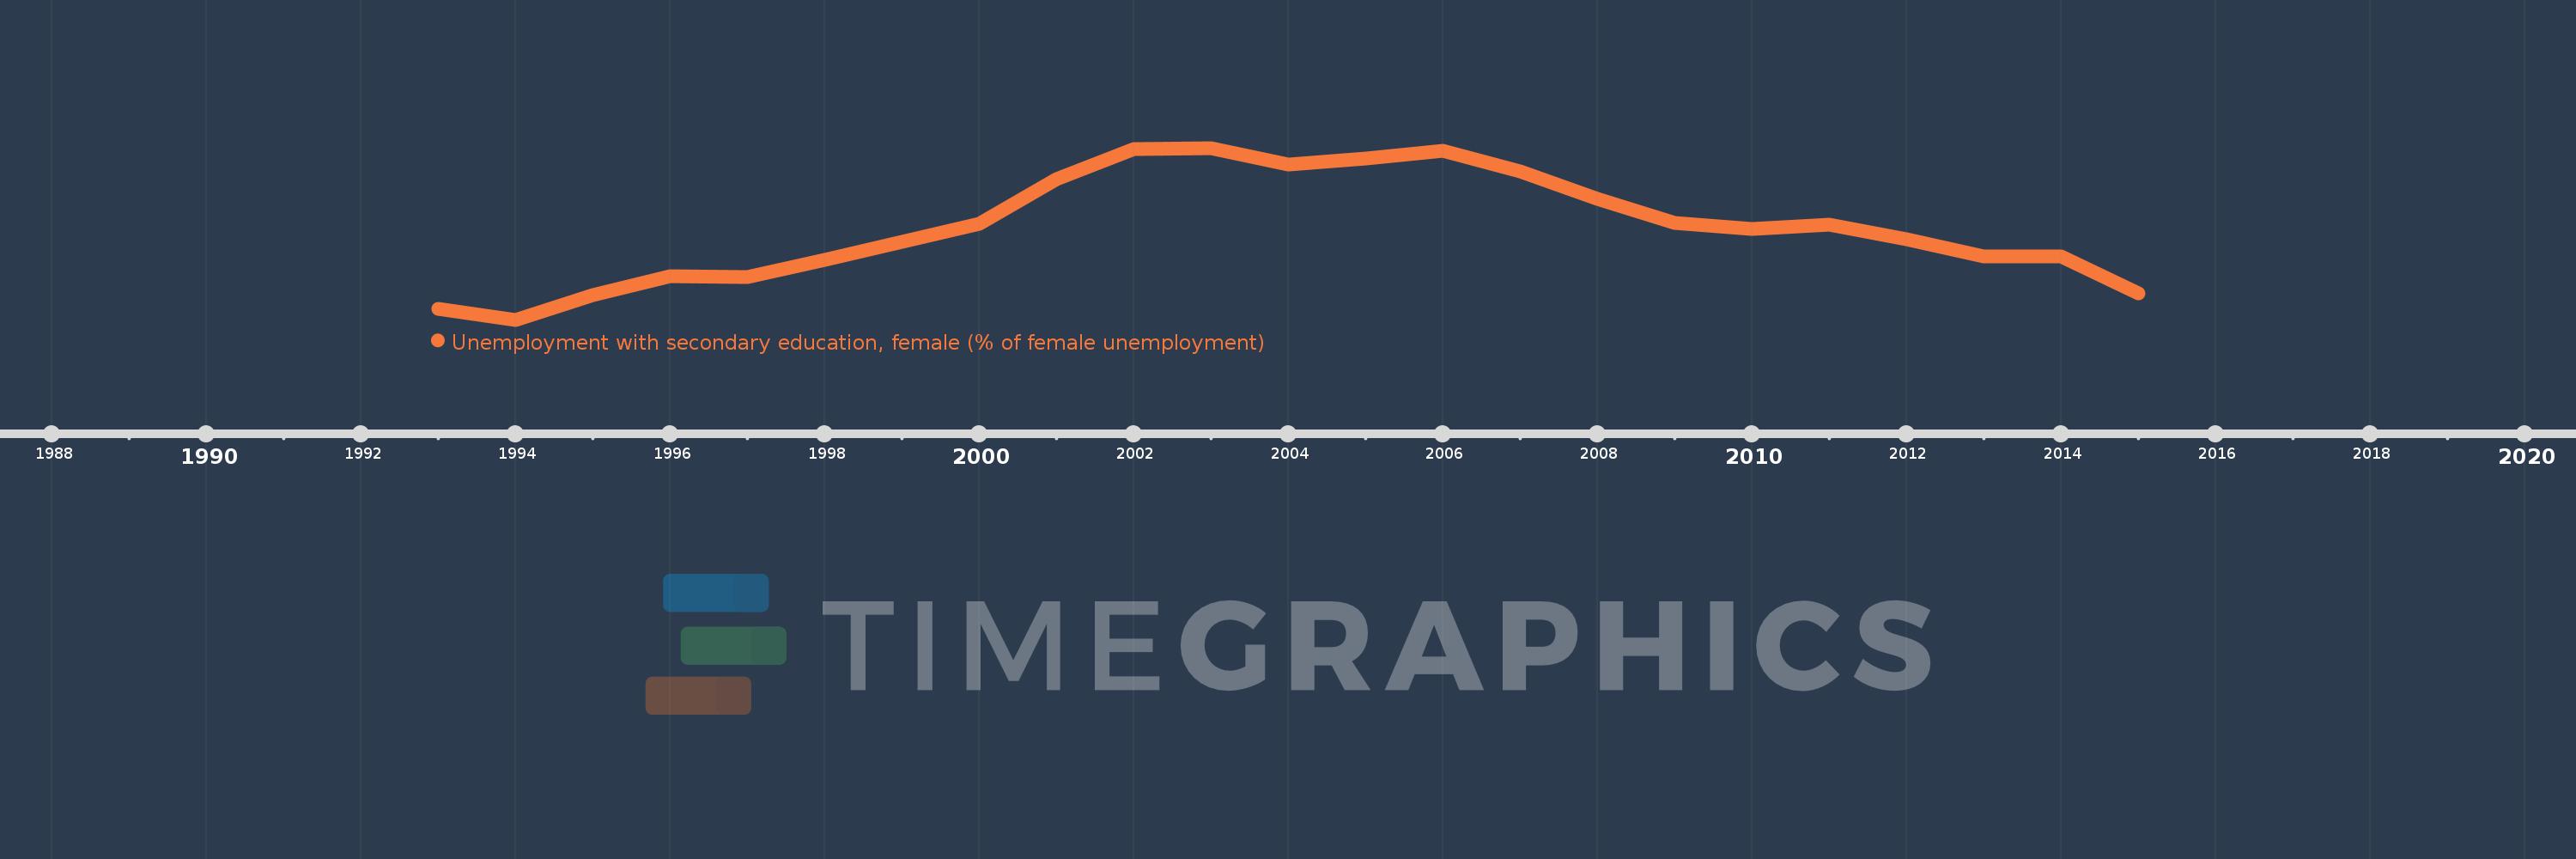
Unemployment with secondary education, female (% of female unemployment)
2015,2014,2013,2012,2011,2010,2009,2008,2007,2006,2005,2004,2003,2002,2001,2000,1999,1998,1997,1996,1995,1994,1993
This statistics in other country:
Timeline:
This timeline shows a graph from 1993 to 2015 of European Union. No data until 1992. Number of actual observations by date: 23.
Source name:
World Development Indicators
Source organization:
International Labour Organization, Key Indicators of the Labour Market database.
Categories, topics:
Social Protection & Labor, Gender
Last updated:
apr 23, 2017
Indicators value changes by year
Minimum:
43.485
jan 1, 1994
Maximum:
52.779
jan 1, 2003
At the date of observation
Value
Absolute change
Change from previous value
jan 1, 1993
44.065
+44.065
0.0%
jan 1, 1994
43.485
-0.58
-1.32%
jan 1, 1995
44.797
+1.311
3.02%
jan 1, 1996
45.819
+1.023
2.28%
jan 1, 1997
45.814
-0.006
-0.01%
jan 1, 1998
46.737
+0.923
2.02%
jan 1, 1999
47.722
+0.985
2.11%
jan 1, 2000
48.661
+0.939
1.97%
jan 1, 2001
51.091
+2.43
4.99%
jan 1, 2002
52.715
+1.625
3.18%
jan 1, 2003
52.779
+0.064
0.12%
jan 1, 2004
51.898
-0.882
-1.67%
jan 1, 2005
52.19
+0.292
0.56%
jan 1, 2006
52.633
+0.443
0.85%
jan 1, 2007
51.527
-1.106
-2.1%
jan 1, 2008
50.027
-1.5
-2.91%
jan 1, 2009
48.705
-1.323
-2.64%
jan 1, 2010
48.399
-0.306
-0.63%
jan 1, 2011
48.611
+0.213
0.44%
jan 1, 2012
47.817
-0.795
-1.63%
jan 1, 2013
46.911
-0.906
-1.89%
jan 1, 2014
46.892
-0.019
-0.04%
jan 1, 2015
44.907
-1.985
-4.23%
Ranking of countries by current statistics by years


Comments: