29
/
en
AIzaSyAYiBZKx7MnpbEhh9jyipgxe19OcubqV5w
April 1, 2024
31219
Europe & Central Asia
ECS
false
2
1
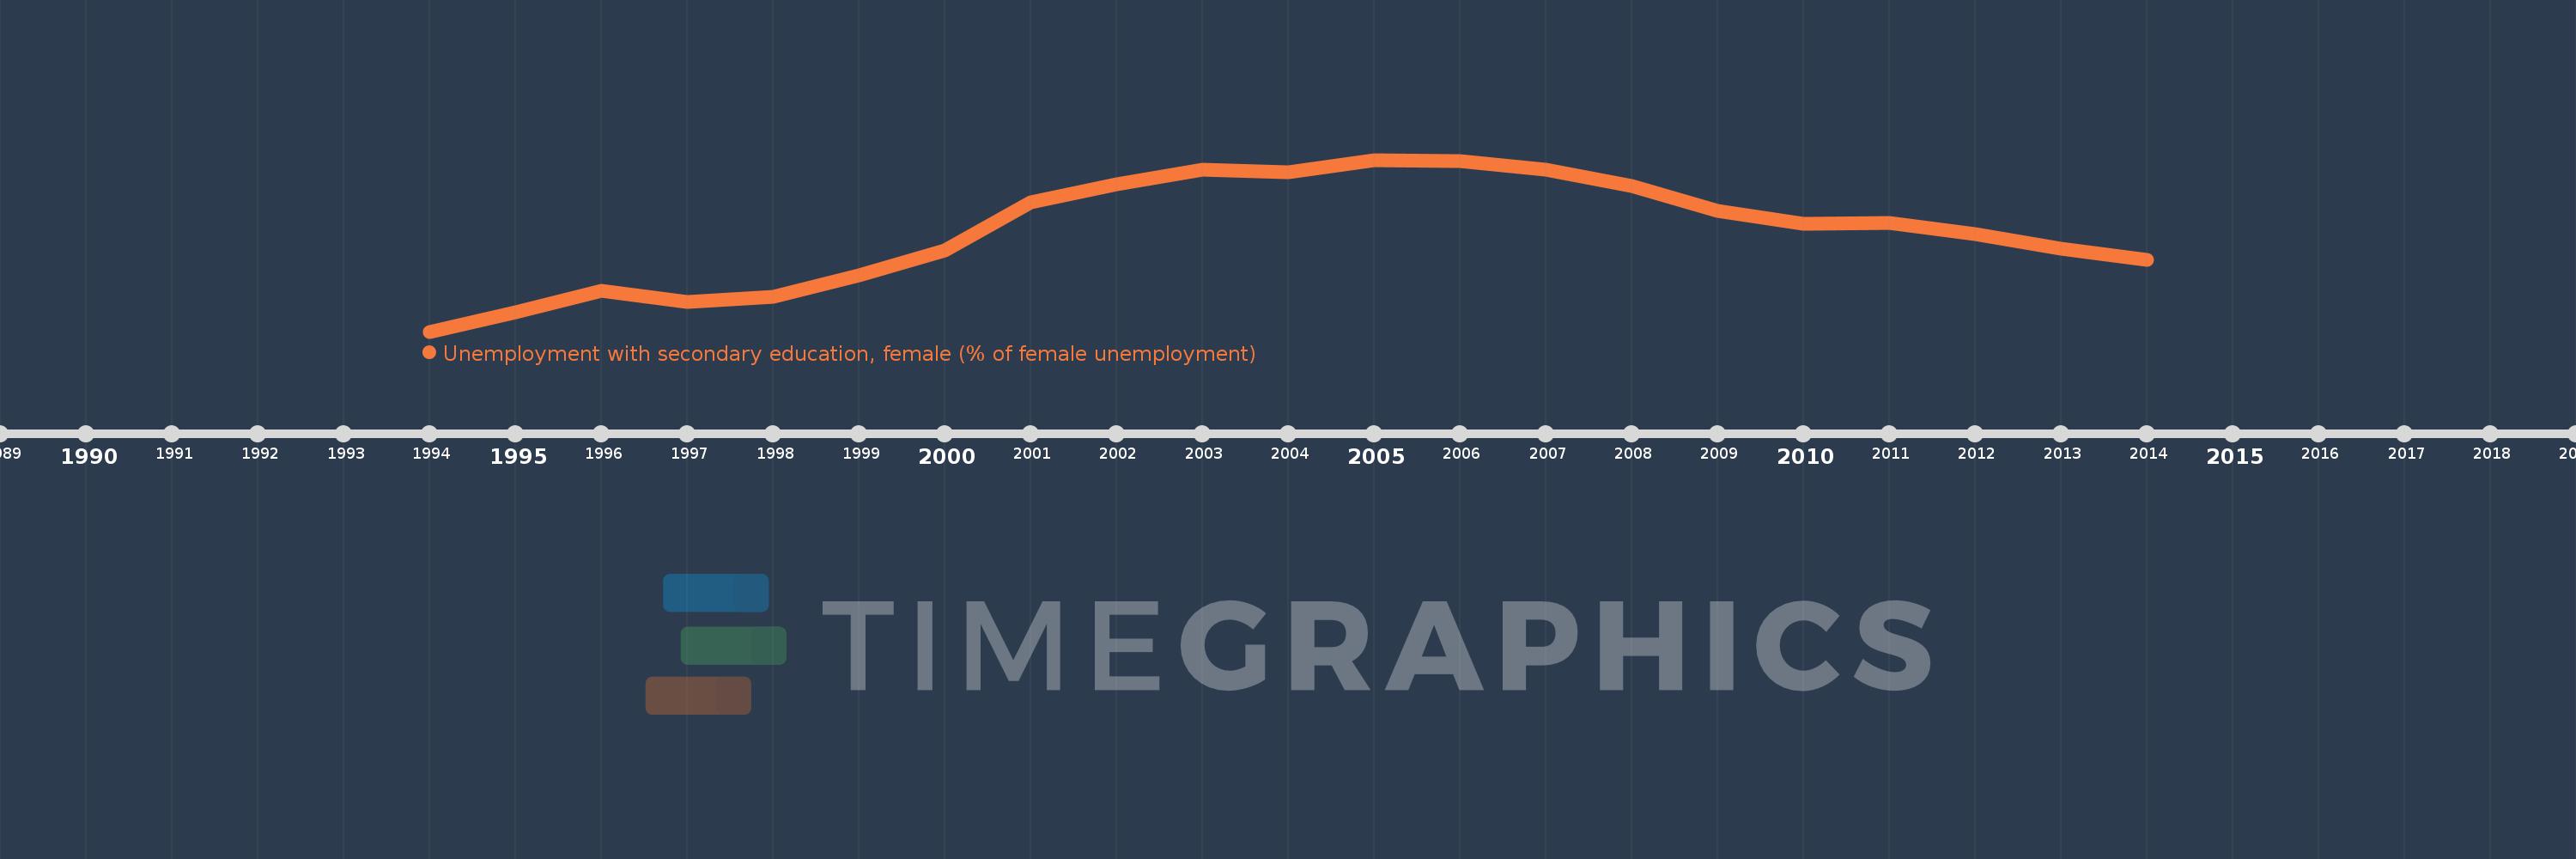
Unemployment with secondary education, female (% of female unemployment)
2014,2013,2012,2011,2010,2009,2008,2007,2006,2005,2004,2003,2002,2001,2000,1999,1998,1997,1996,1995,1994
This statistics in other country:
Timeline:
This timeline shows a graph from 1994 to 2014 of Europe & Central Asia. No data until 1993. Number of actual observations by date: 21.
Source name:
World Development Indicators
Source organization:
International Labour Organization, Key Indicators of the Labour Market database.
Categories, topics:
Social Protection & Labor, Gender
Last updated:
apr 23, 2017
Indicators value changes by year
Minimum:
41.387
jan 1, 1994
Maximum:
51.199
jan 1, 2005
At the date of observation
Value
Absolute change
Change from previous value
jan 1, 1994
41.387
+41.387
0.0%
jan 1, 1995
42.476
+1.089
2.63%
jan 1, 1996
43.698
+1.223
2.88%
jan 1, 1997
43.092
-0.606
-1.39%
jan 1, 1998
43.353
+0.261
0.6%
jan 1, 1999
44.596
+1.243
2.87%
jan 1, 2000
46.021
+1.425
3.2%
jan 1, 2001
48.791
+2.77
6.02%
jan 1, 2002
49.798
+1.007
2.06%
jan 1, 2003
50.619
+0.822
1.65%
jan 1, 2004
50.499
-0.12
-0.24%
jan 1, 2005
51.199
+0.699
1.39%
jan 1, 2006
51.13
-0.069
-0.14%
jan 1, 2007
50.659
-0.471
-0.92%
jan 1, 2008
49.685
-0.974
-1.92%
jan 1, 2009
48.262
-1.423
-2.86%
jan 1, 2010
47.527
-0.735
-1.52%
jan 1, 2011
47.578
+0.051
0.11%
jan 1, 2012
46.977
-0.601
-1.26%
jan 1, 2013
46.117
-0.86
-1.83%
jan 1, 2014
45.479
-0.638
-1.38%
Ranking of countries by current statistics by years


Comments: