29
/
en
AIzaSyAYiBZKx7MnpbEhh9jyipgxe19OcubqV5w
April 1, 2024
32301
Europe & Central Asia (excluding high income)
ECA
false
2
1
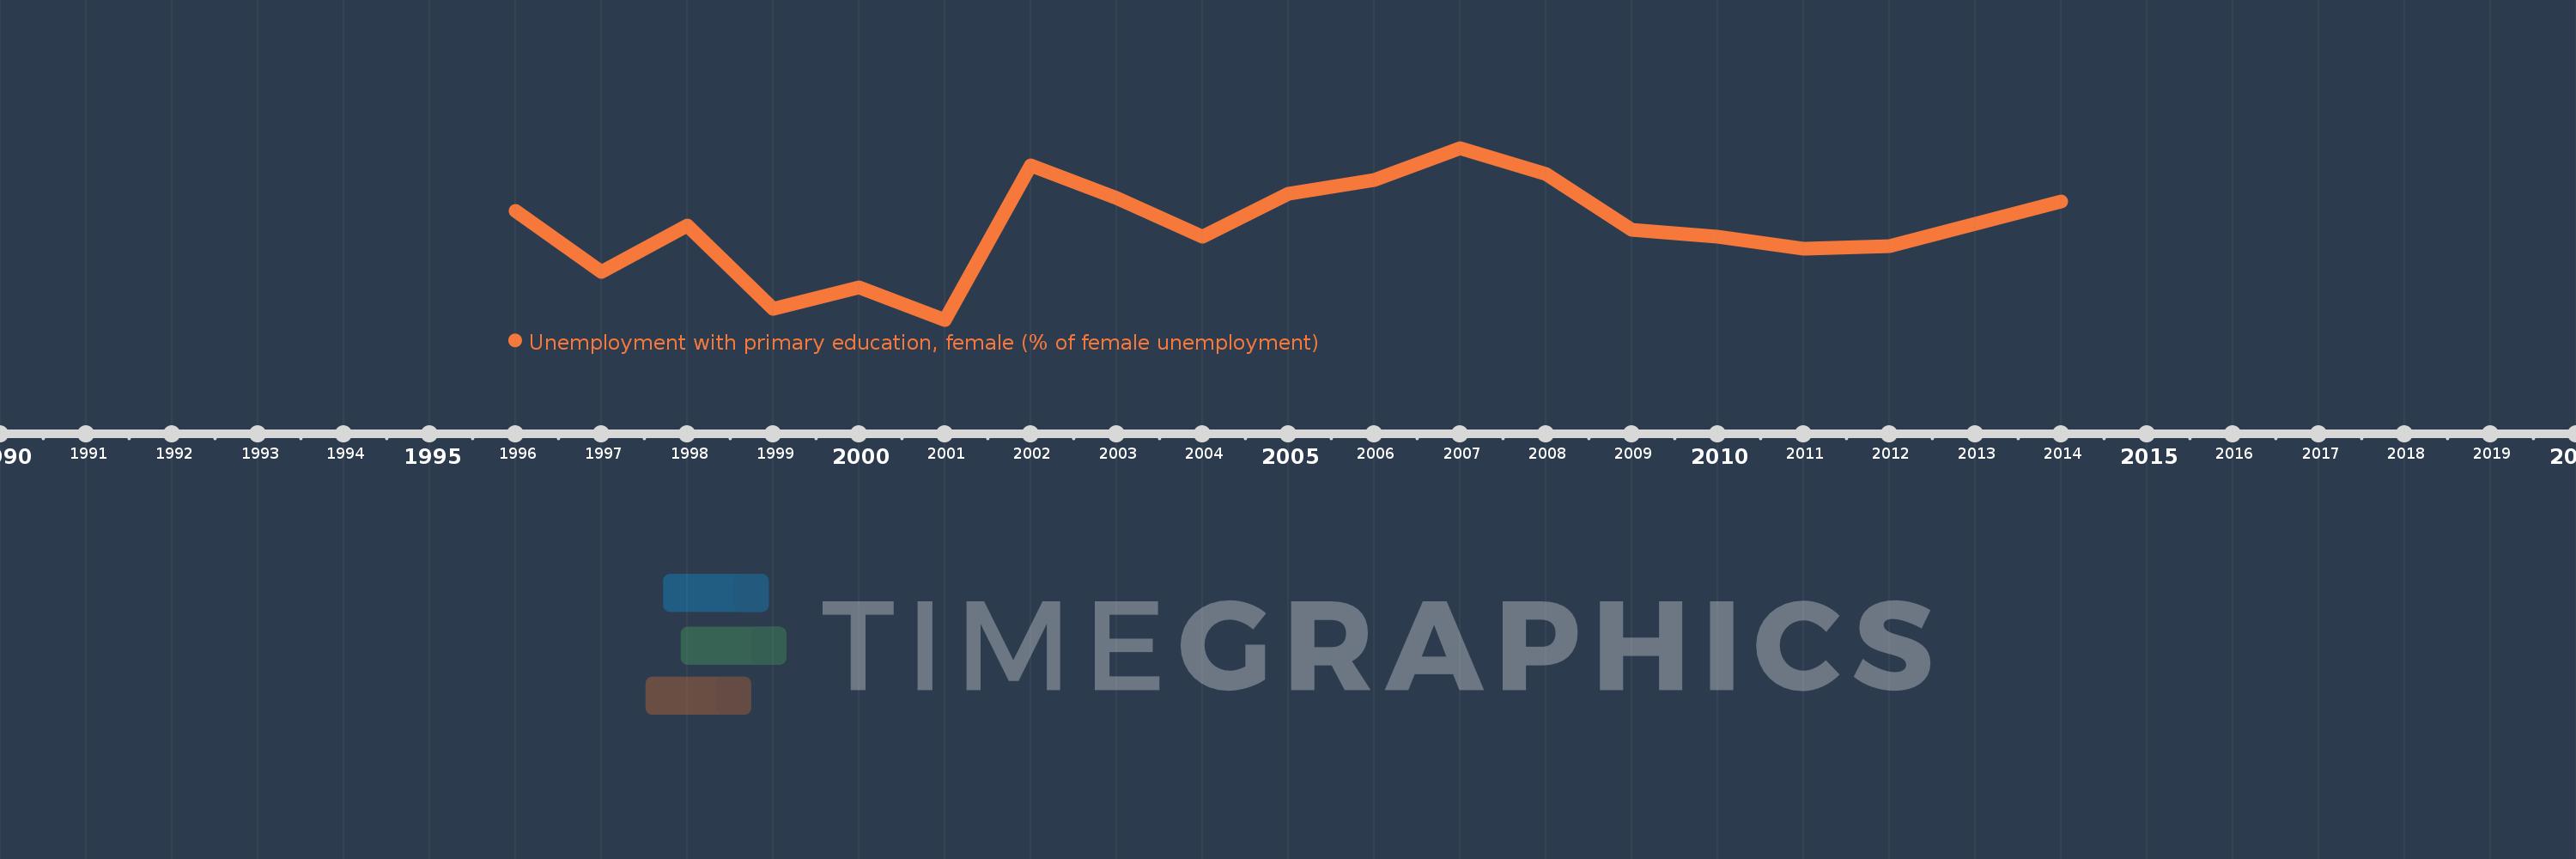
Unemployment with primary education, female (% of female unemployment)
2014,2012,2011,2010,2009,2008,2007,2006,2005,2004,2003,2002,2001,2000,1999,1998,1997,1996
This statistics in other country:
Timeline:
This timeline shows a graph from 1996 to 2014 of Europe & Central Asia (excluding high income). No data until 1995. Number of actual observations by date: 18.
Source name:
World Development Indicators
Source organization:
International Labour Organization, Key Indicators of the Labour Market database.
Categories, topics:
Social Protection & Labor, Gender
Last updated:
apr 23, 2017
Indicators value changes by year
Minimum:
14.567
jan 1, 2001
Maximum:
19.347
jan 1, 2007
At the date of observation
Value
Absolute change
Change from previous value
jan 1, 1996
17.598
+17.598
0.0%
jan 1, 1997
15.897
-1.702
-9.67%
jan 1, 1998
17.179
+1.283
8.07%
jan 1, 1999
14.868
-2.312
-13.46%
jan 1, 2000
15.463
+0.595
4.01%
jan 1, 2001
14.567
-0.896
-5.79%
jan 1, 2002
18.852
+4.284
29.41%
jan 1, 2003
17.944
-0.908
-4.82%
jan 1, 2004
16.875
-1.069
-5.96%
jan 1, 2005
18.063
+1.188
7.04%
jan 1, 2006
18.446
+0.383
2.12%
jan 1, 2007
19.347
+0.901
4.88%
jan 1, 2008
18.622
-0.725
-3.75%
jan 1, 2009
17.081
-1.542
-8.28%
jan 1, 2010
16.872
-0.208
-1.22%
jan 1, 2011
16.532
-0.34
-2.02%
jan 1, 2012
16.62
+0.088
0.53%
jan 1, 2014
17.85
+1.23
7.4%
Ranking of countries by current statistics by years


Comments: