29
/
en
AIzaSyAYiBZKx7MnpbEhh9jyipgxe19OcubqV5w
April 1, 2024
53136
OECD members
OED
false
2
1
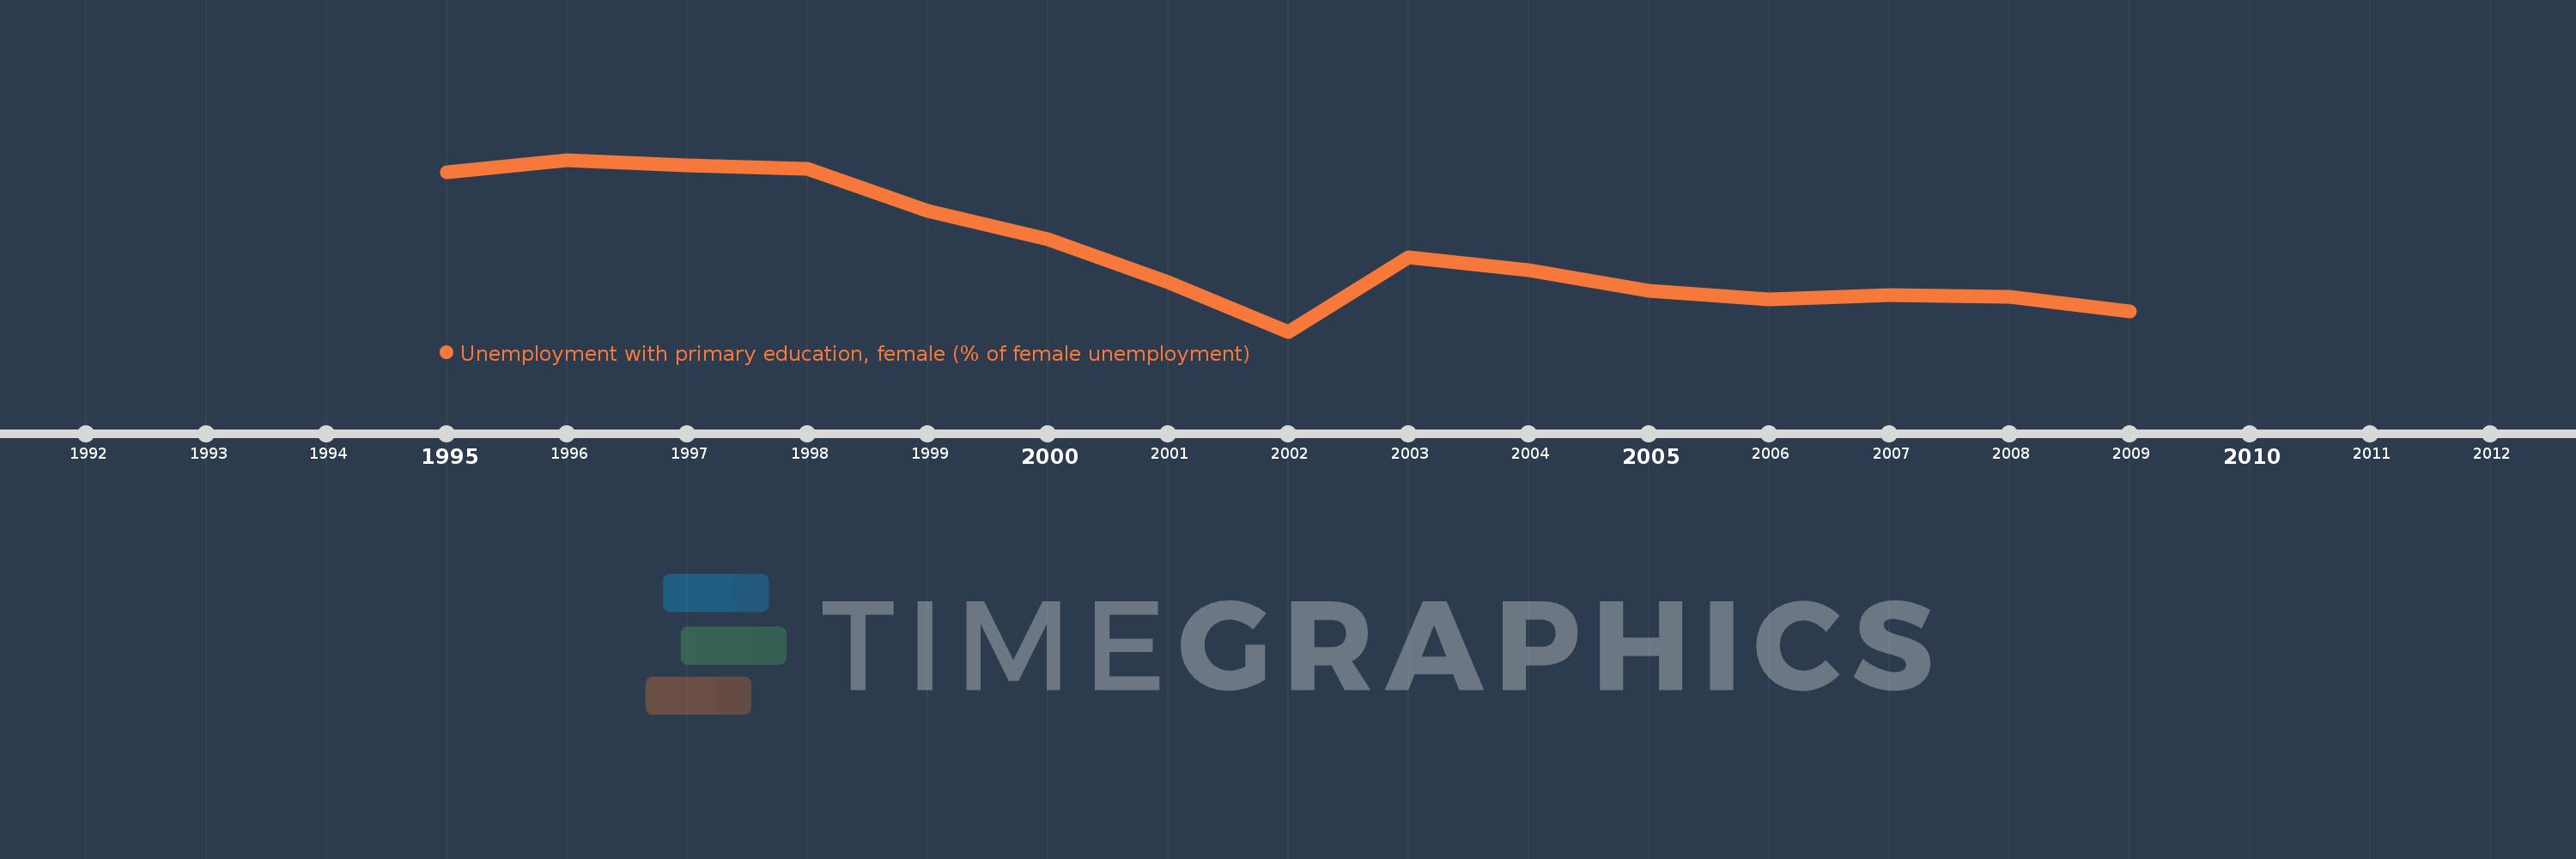
Unemployment with primary education, female (% of female unemployment)
2009,2008,2007,2006,2005,2004,2003,2002,2001,2000,1999,1998,1997,1996,1995
This statistics in other country:
Timeline:
This timeline shows a graph from 1995 to 2009 of OECD members. No data until 1994. Number of actual observations by date: 15.
Source name:
World Development Indicators
Source organization:
International Labour Organization, Key Indicators of the Labour Market database.
Categories, topics:
Social Protection & Labor, Gender
Last updated:
apr 23, 2017
Indicators value changes by year
Maximum:
36.182
jan 1, 1996
At the date of observation
Value
Absolute change
Change from previous value
jan 1, 1995
35.755
+35.755
0.0%
jan 1, 1996
36.182
+0.427
1.19%
jan 1, 1997
35.993
-0.189
-0.52%
jan 1, 1998
35.867
-0.127
-0.35%
jan 1, 1999
34.436
-1.431
-3.99%
jan 1, 2000
33.49
-0.945
-2.75%
jan 1, 2001
32.029
-1.461
-4.36%
jan 1, 2002
30.35
-1.68
-5.24%
jan 1, 2003
32.884
+2.535
8.35%
jan 1, 2004
32.428
-0.456
-1.39%
jan 1, 2005
31.722
-0.706
-2.18%
jan 1, 2006
31.44
-0.282
-0.89%
jan 1, 2007
31.576
+0.136
0.43%
jan 1, 2008
31.54
-0.036
-0.11%
jan 1, 2009
31.047
-0.493
-1.56%
Ranking of countries by current statistics by years


Comments: