29
/
en
AIzaSyAYiBZKx7MnpbEhh9jyipgxe19OcubqV5w
April 1, 2024
31216
Europe & Central Asia
ECS
false
2
1
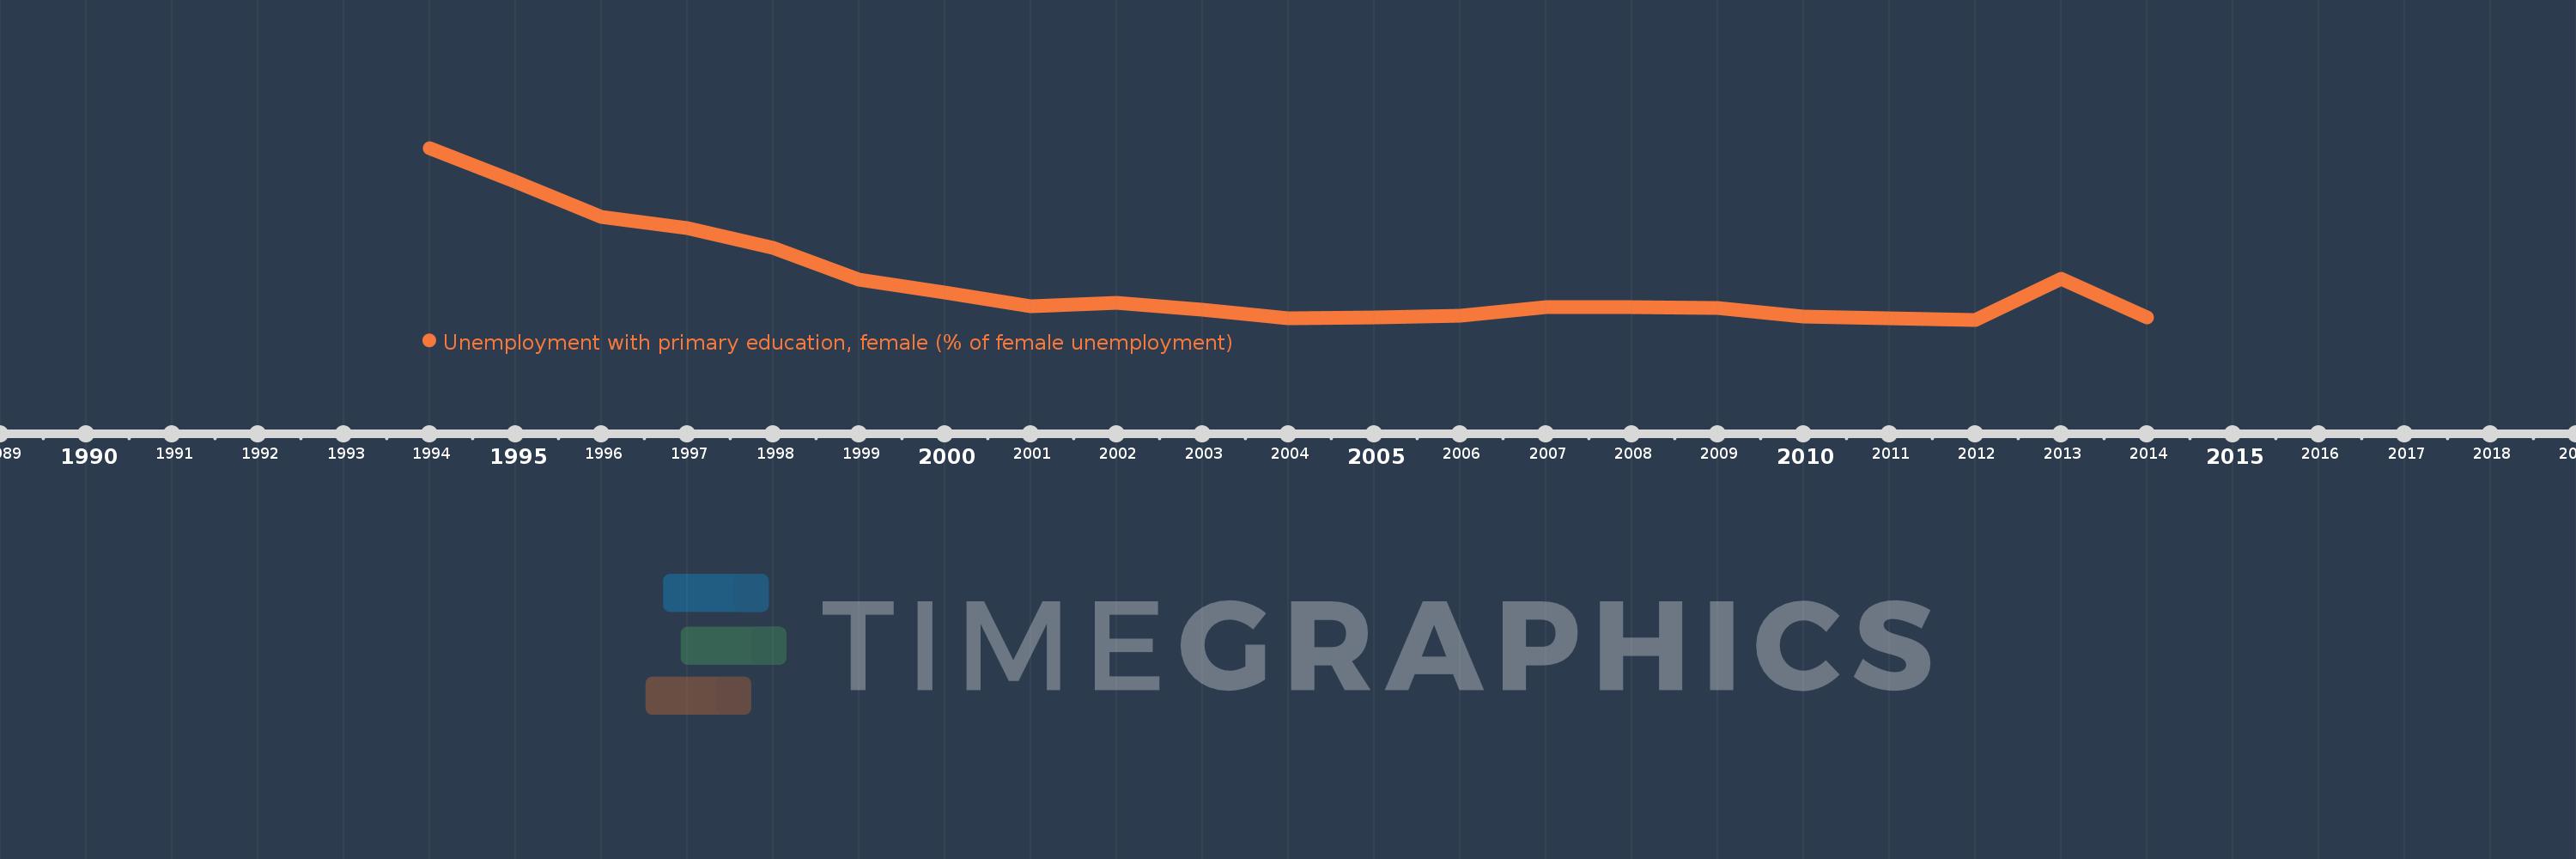
Unemployment with primary education, female (% of female unemployment)
2014,2013,2012,2011,2010,2009,2008,2007,2006,2005,2004,2003,2002,2001,2000,1999,1998,1997,1996,1995,1994
This statistics in other country:
Timeline:
This timeline shows a graph from 1994 to 2014 of Europe & Central Asia. No data until 1993. Number of actual observations by date: 21.
Source name:
World Development Indicators
Source organization:
International Labour Organization, Key Indicators of the Labour Market database.
Categories, topics:
Social Protection & Labor, Gender
Last updated:
apr 23, 2017
Indicators value changes by year
Minimum:
26.667
jan 1, 2012
Maximum:
39.291
jan 1, 1994
At the date of observation
Value
Absolute change
Change from previous value
jan 1, 1994
39.291
+39.291
0.0%
jan 1, 1995
36.79
-2.501
-6.37%
jan 1, 1996
34.208
-2.582
-7.02%
jan 1, 1997
33.399
-0.808
-2.36%
jan 1, 1998
31.93
-1.469
-4.4%
jan 1, 1999
29.586
-2.344
-7.34%
jan 1, 2000
28.657
-0.929
-3.14%
jan 1, 2001
27.679
-0.978
-3.41%
jan 1, 2002
27.938
+0.259
0.94%
jan 1, 2003
27.404
-0.534
-1.91%
jan 1, 2004
26.748
-0.656
-2.39%
jan 1, 2005
26.846
+0.098
0.37%
jan 1, 2006
26.939
+0.093
0.35%
jan 1, 2007
27.601
+0.662
2.46%
jan 1, 2008
27.624
+0.023
0.08%
jan 1, 2009
27.556
-0.068
-0.25%
jan 1, 2010
26.886
-0.67
-2.43%
jan 1, 2011
26.775
-0.11
-0.41%
jan 1, 2012
26.667
-0.108
-0.4%
jan 1, 2013
29.698
+3.031
11.36%
jan 1, 2014
26.863
-2.835
-9.54%
Ranking of countries by current statistics by years


Comments: