29
/
en
AIzaSyAYiBZKx7MnpbEhh9jyipgxe19OcubqV5w
April 1, 2024
32156
Europe & Central Asia (excluding high income)
ECA
false
2
1
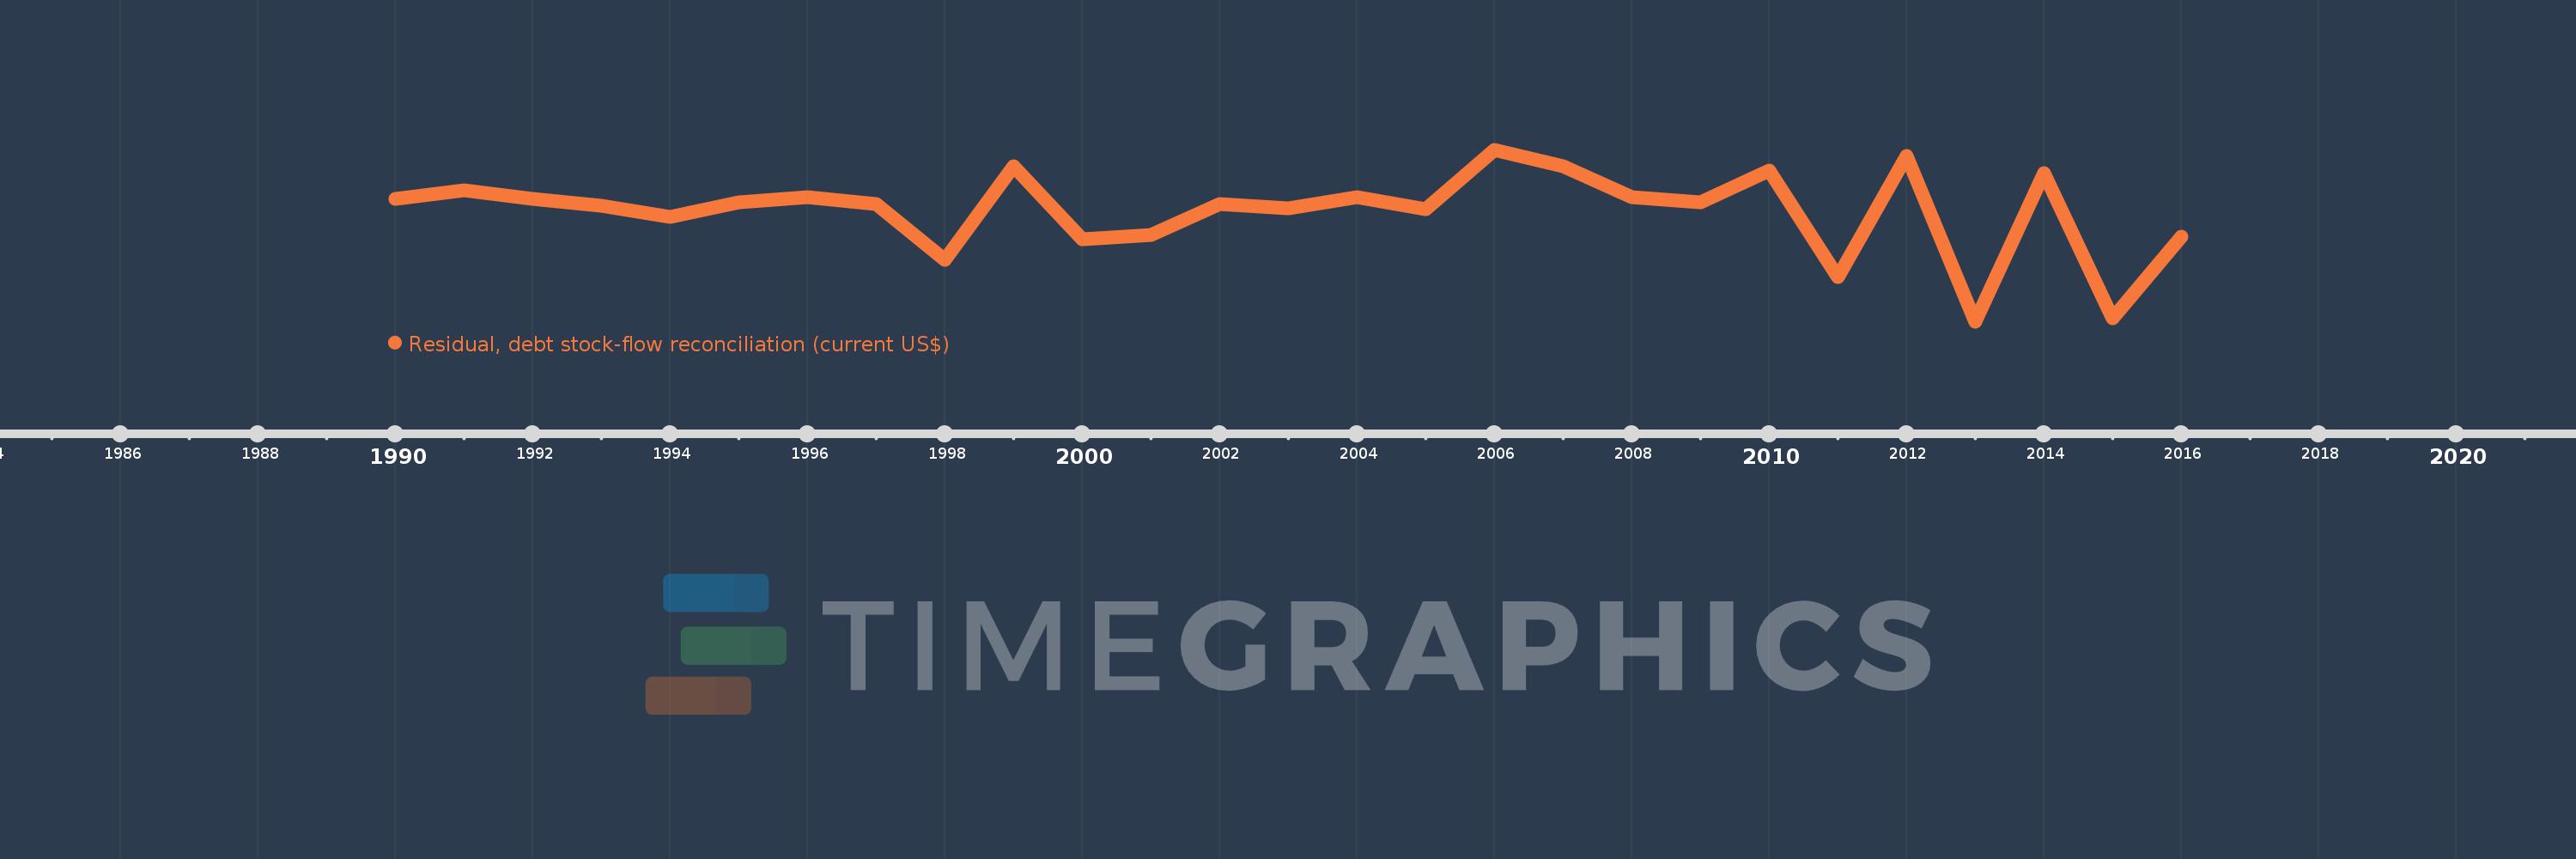
Residual, debt stock-flow reconciliation (current US$)
2016,2015,2014,2013,2012,2011,2010,2009,2008,2007,2006,2005,2004,2003,2002,2001,2000,1999,1998,1997,1996,1995,1994,1993,1992,1991,1990
This statistics in other country:
Timeline:
This timeline shows a graph from 1990 to 2016 of Europe & Central Asia (excluding high income). No data until 1989. Number of actual observations by date: 27.
Source name:
World Development Indicators
Source organization:
World Bank, International Debt Statistics.
Categories, topics:
External Debt
Last updated:
apr 23, 2017
Indicators value changes by year
Minimum:
-55.729 bln
jan 1, 2013
Maximum:
26.029 bln
jan 1, 2006
At the date of observation
Value
Absolute change
Change from previous value
jan 1, 1990
2.955 bln
+2.955 bln
0.0%
jan 1, 1991
7.119 bln
+4.164 bln
140.91%
jan 1, 1992
2.828 bln
-4.291 bln
-60.27%
jan 1, 1993
-325.772 mln
-3.154 bln
-111.52%
jan 1, 1994
-5.808 bln
-5.482 bln
1.68K%
jan 1, 1995
1.052 bln
+6.86 bln
-118.12%
jan 1, 1996
3.542 bln
+2.489 bln
236.51%
jan 1, 1997
282.528 mln
-3.259 bln
-92.02%
jan 1, 1998
-26.179 bln
-26.462 bln
-9.37K%
jan 1, 1999
18.355 bln
+44.534 bln
-170.11%
jan 1, 2000
-16.305 bln
-34.66 bln
-188.83%
jan 1, 2001
-14.35 bln
+1.955 bln
-11.99%
jan 1, 2002
216.428 mln
+14.566 bln
-101.51%
jan 1, 2003
-1.449 bln
-1.665 bln
-769.38%
jan 1, 2004
3.556 bln
+5.005 bln
-345.48%
jan 1, 2005
-2.014 bln
-5.57 bln
-156.63%
jan 1, 2006
26.029 bln
+28.043 bln
-1.39K%
jan 1, 2007
18.251 bln
-7.778 bln
-29.88%
jan 1, 2008
3.503 bln
-14.749 bln
-80.81%
jan 1, 2009
1.2 bln
-2.303 bln
-65.74%
jan 1, 2010
16.167 bln
+14.967 bln
1.25K%
jan 1, 2011
-34.284 bln
-50.451 bln
-312.07%
jan 1, 2012
23.312 bln
+57.596 bln
-167.99%
jan 1, 2013
-55.729 bln
-79.041 bln
-339.06%
jan 1, 2014
15.088 bln
+70.817 bln
-127.07%
jan 1, 2015
-54.14 bln
-69.228 bln
-458.83%
jan 1, 2016
-15.126 bln
+39.014 bln
-72.06%
Ranking of countries by current statistics by years


Comments: