29
/
en
AIzaSyAYiBZKx7MnpbEhh9jyipgxe19OcubqV5w
April 1, 2024
252443
St. Vincent and the Grenadines
VCT
true
2
1
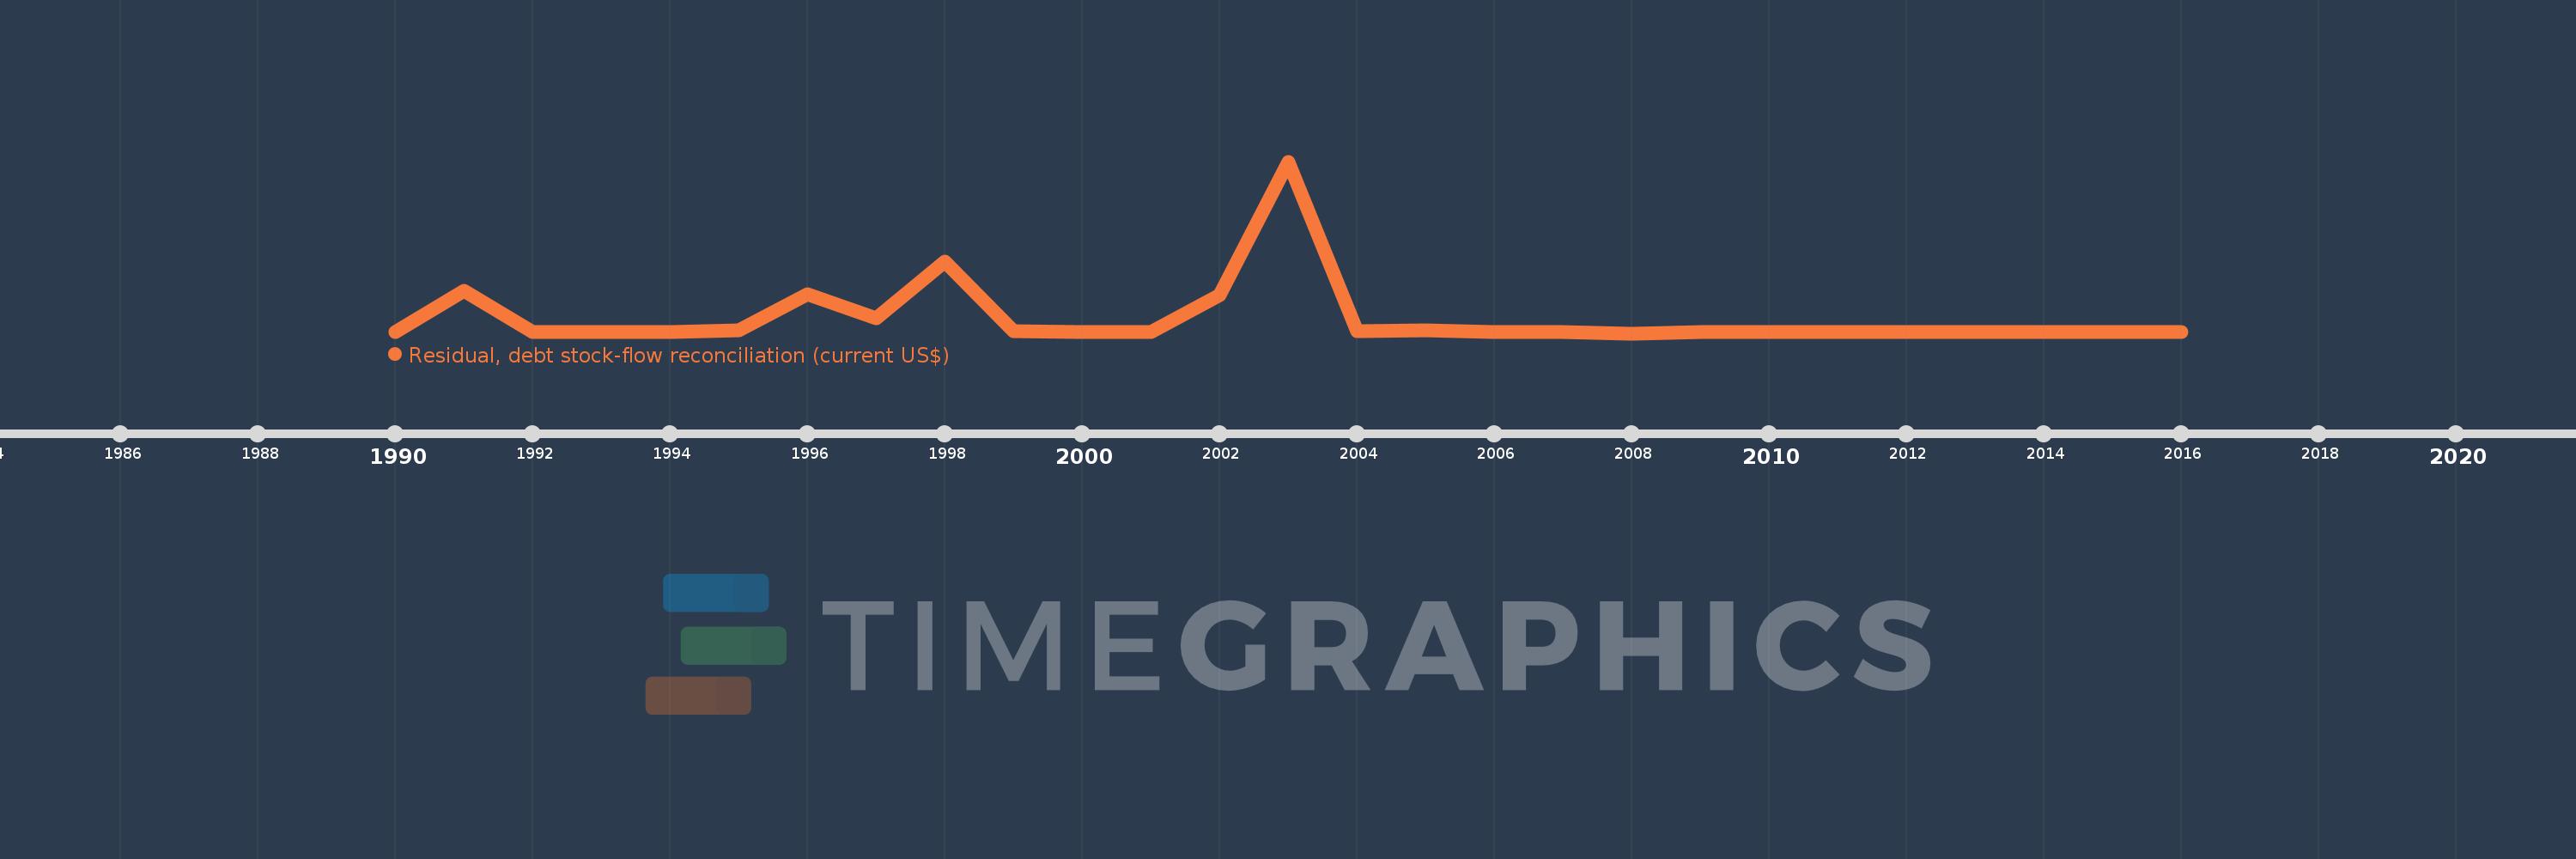
Residual, debt stock-flow reconciliation (current US$)
2016,2015,2014,2013,2012,2011,2010,2009,2008,2007,2006,2005,2004,2003,2002,2001,2000,1999,1998,1997,1996,1995,1994,1993,1992,1991,1990
This statistics in other country:
Timeline:
This timeline shows a graph from 1990 to 2016 of St. Vincent and the Grenadines. No data until 1989. Number of actual observations by date: 27.
Source name:
World Development Indicators
Source organization:
World Bank, International Debt Statistics.
Categories, topics:
External Debt
Last updated:
apr 23, 2017
Indicators value changes by year
Minimum:
-29.0K
jan 1, 2008
Maximum:
3.455 mln
jan 1, 2003
At the date of observation
Value
Absolute change
Change from previous value
jan 1, 1991
840.0K
+840.0K
%
jan 1, 1992
2.0K
-838.0K
-99.76%
jan 1, 1993
-5.0K
-7.0K
-350.0%
jan 1, 1994
-1000.0
+4.0K
-80.0%
jan 1, 1995
27.0K
+28.0K
-2.8K%
jan 1, 1996
764.0K
+737.0K
2.73K%
jan 1, 1997
280.0K
-484.0K
-63.35%
jan 1, 1998
1.417 mln
+1.137 mln
406.07%
jan 1, 1999
20.0K
-1.397 mln
-98.59%
jan 1, 2000
0.0
-20.0K
-100.0%
jan 1, 2001
-10.0K
-10.0K
%
jan 1, 2002
754.0K
+764.0K
-7.64K%
jan 1, 2003
3.455 mln
+2.701 mln
358.22%
jan 1, 2004
10.0K
-3.445 mln
-99.71%
jan 1, 2005
34.0K
+24.0K
240.0%
jan 1, 2006
-5.0K
-39.0K
-114.71%
jan 1, 2007
-5.0K
0.0
0.0%
jan 1, 2008
-29.0K
-24.0K
480.0%
jan 1, 2009
0.0
+29.0K
-100.0%
jan 1, 2010
-1000.0
-1000.0
%
jan 1, 2011
0.0
+1000.0
-100.0%
jan 1, 2013
-1000.0
-1000.0
%
jan 1, 2014
0.0
+1000.0
-100.0%
Ranking of countries by current statistics by years


Comments: