29
/
en
AIzaSyAYiBZKx7MnpbEhh9jyipgxe19OcubqV5w
April 1, 2024
75674
Azerbaijan
AZE
true
2
1
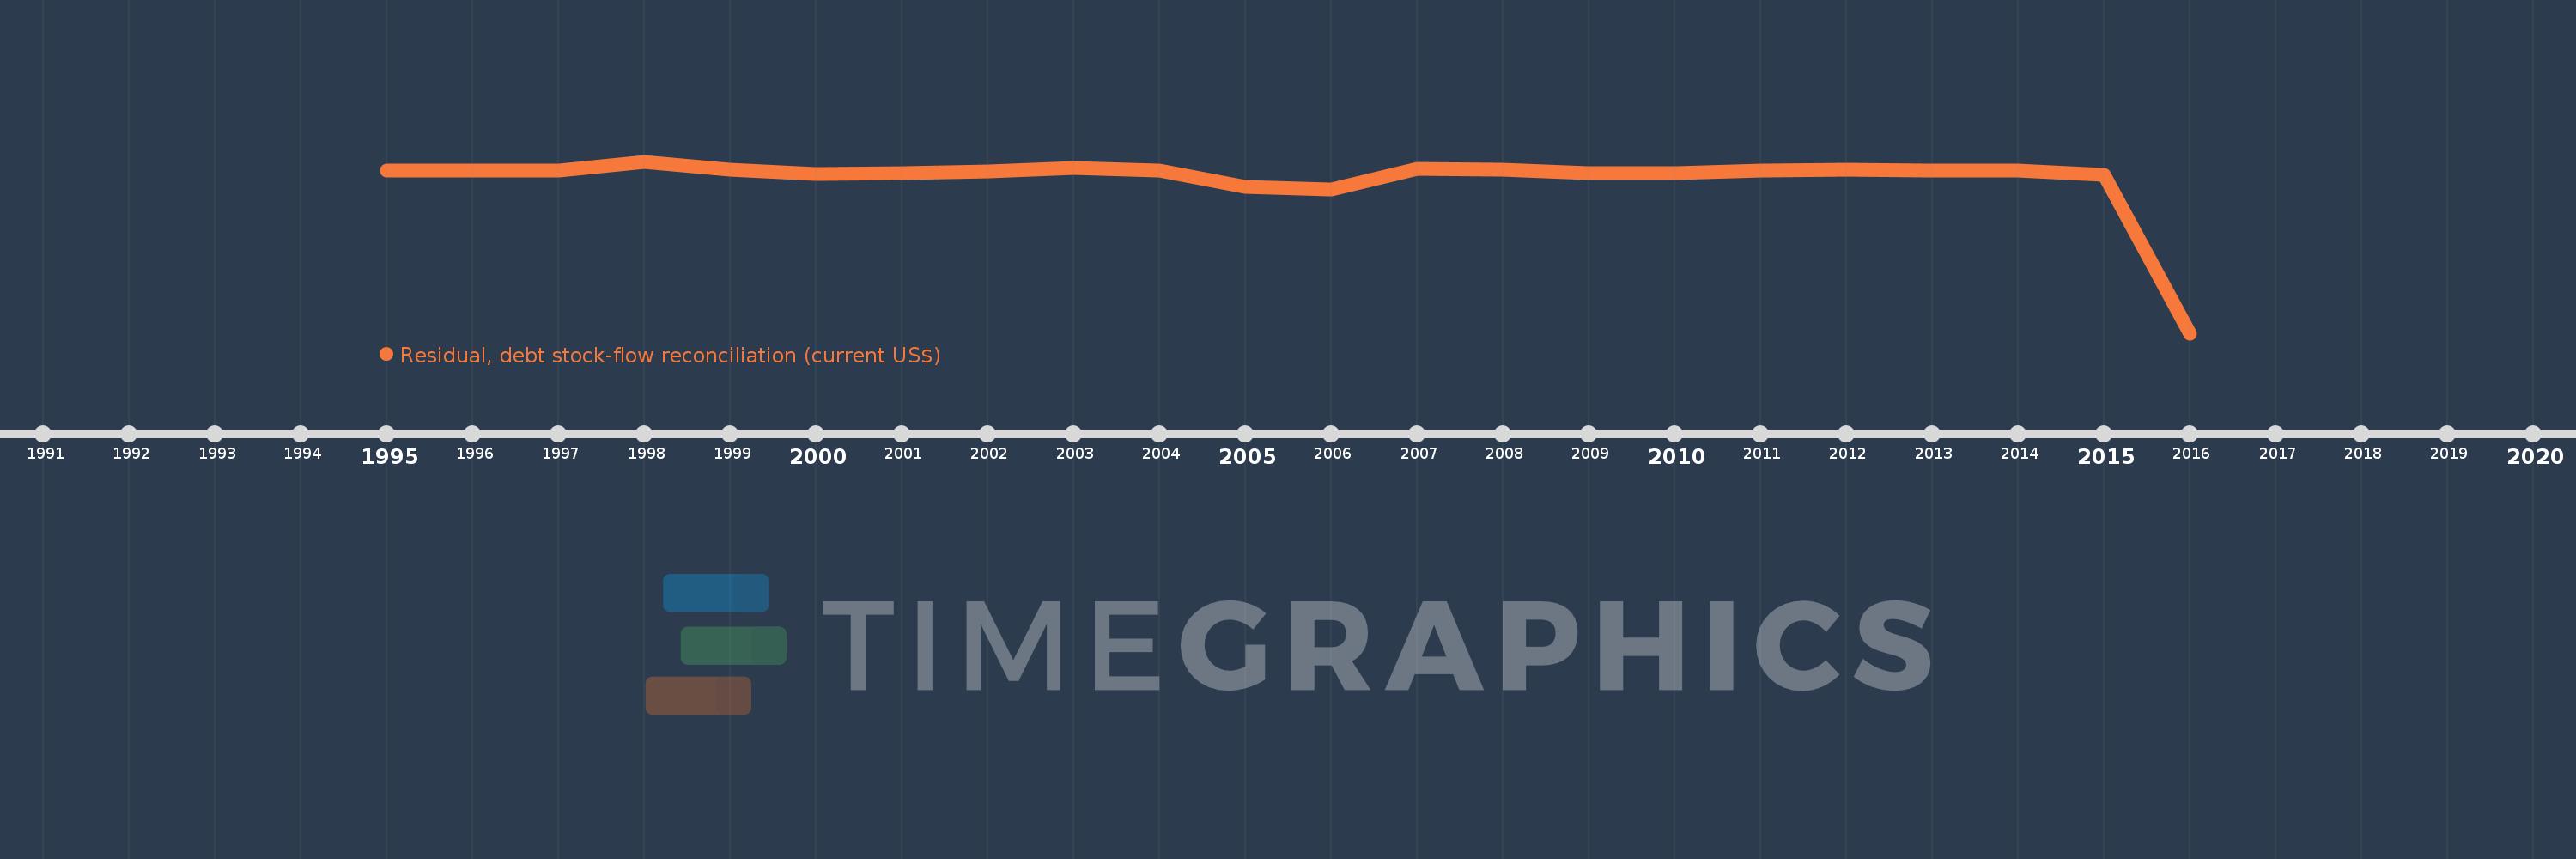
Residual, debt stock-flow reconciliation (current US$)
2016,2015,2014,2013,2012,2011,2010,2009,2008,2007,2006,2005,2004,2003,2002,2001,2000,1999,1998,1997,1996,1995
This statistics in other country:
Timeline:
This timeline shows a graph from 1995 to 2016 of Azerbaijan. No data until 1994. Number of actual observations by date: 22.
Source name:
World Development Indicators
Source organization:
World Bank, International Debt Statistics.
Categories, topics:
External Debt
Last updated:
apr 23, 2017
Indicators value changes by year
Minimum:
-617.774 mln
jan 1, 2016
Maximum:
35.5 mln
jan 1, 1998
At the date of observation
Value
Absolute change
Change from previous value
jan 1, 1998
35.5 mln
+35.5 mln
%
jan 1, 1999
2.897 mln
-32.603 mln
-91.84%
jan 1, 2000
-12.914 mln
-15.811 mln
-545.77%
jan 1, 2001
-8.016 mln
+4.898 mln
-37.93%
jan 1, 2002
-766.0K
+7.25 mln
-90.44%
jan 1, 2003
9.4 mln
+10.166 mln
-1.33K%
jan 1, 2004
534.0K
-8.866 mln
-94.32%
jan 1, 2005
-61.712 mln
-62.246 mln
-11.66K%
jan 1, 2006
-70.321 mln
-8.609 mln
13.95%
jan 1, 2007
7.71 mln
+78.031 mln
-110.96%
jan 1, 2008
3.353 mln
-4.357 mln
-56.51%
jan 1, 2009
-9.331 mln
-12.684 mln
-378.29%
jan 1, 2010
-10.204 mln
-873.0K
9.36%
jan 1, 2011
1.889 mln
+12.093 mln
-118.51%
jan 1, 2012
3.67 mln
+1.781 mln
94.28%
jan 1, 2013
1.54 mln
-2.13 mln
-58.04%
jan 1, 2014
1.65 mln
+110.0K
7.14%
jan 1, 2015
-14.774 mln
-16.424 mln
-995.39%
jan 1, 2016
-617.774 mln
-603.0 mln
4.08K%
Ranking of countries by current statistics by years


Comments: