29
/
en
AIzaSyAYiBZKx7MnpbEhh9jyipgxe19OcubqV5w
April 1, 2024
31757
Europe & Central Asia (excluding high income)
ECA
false
2
1
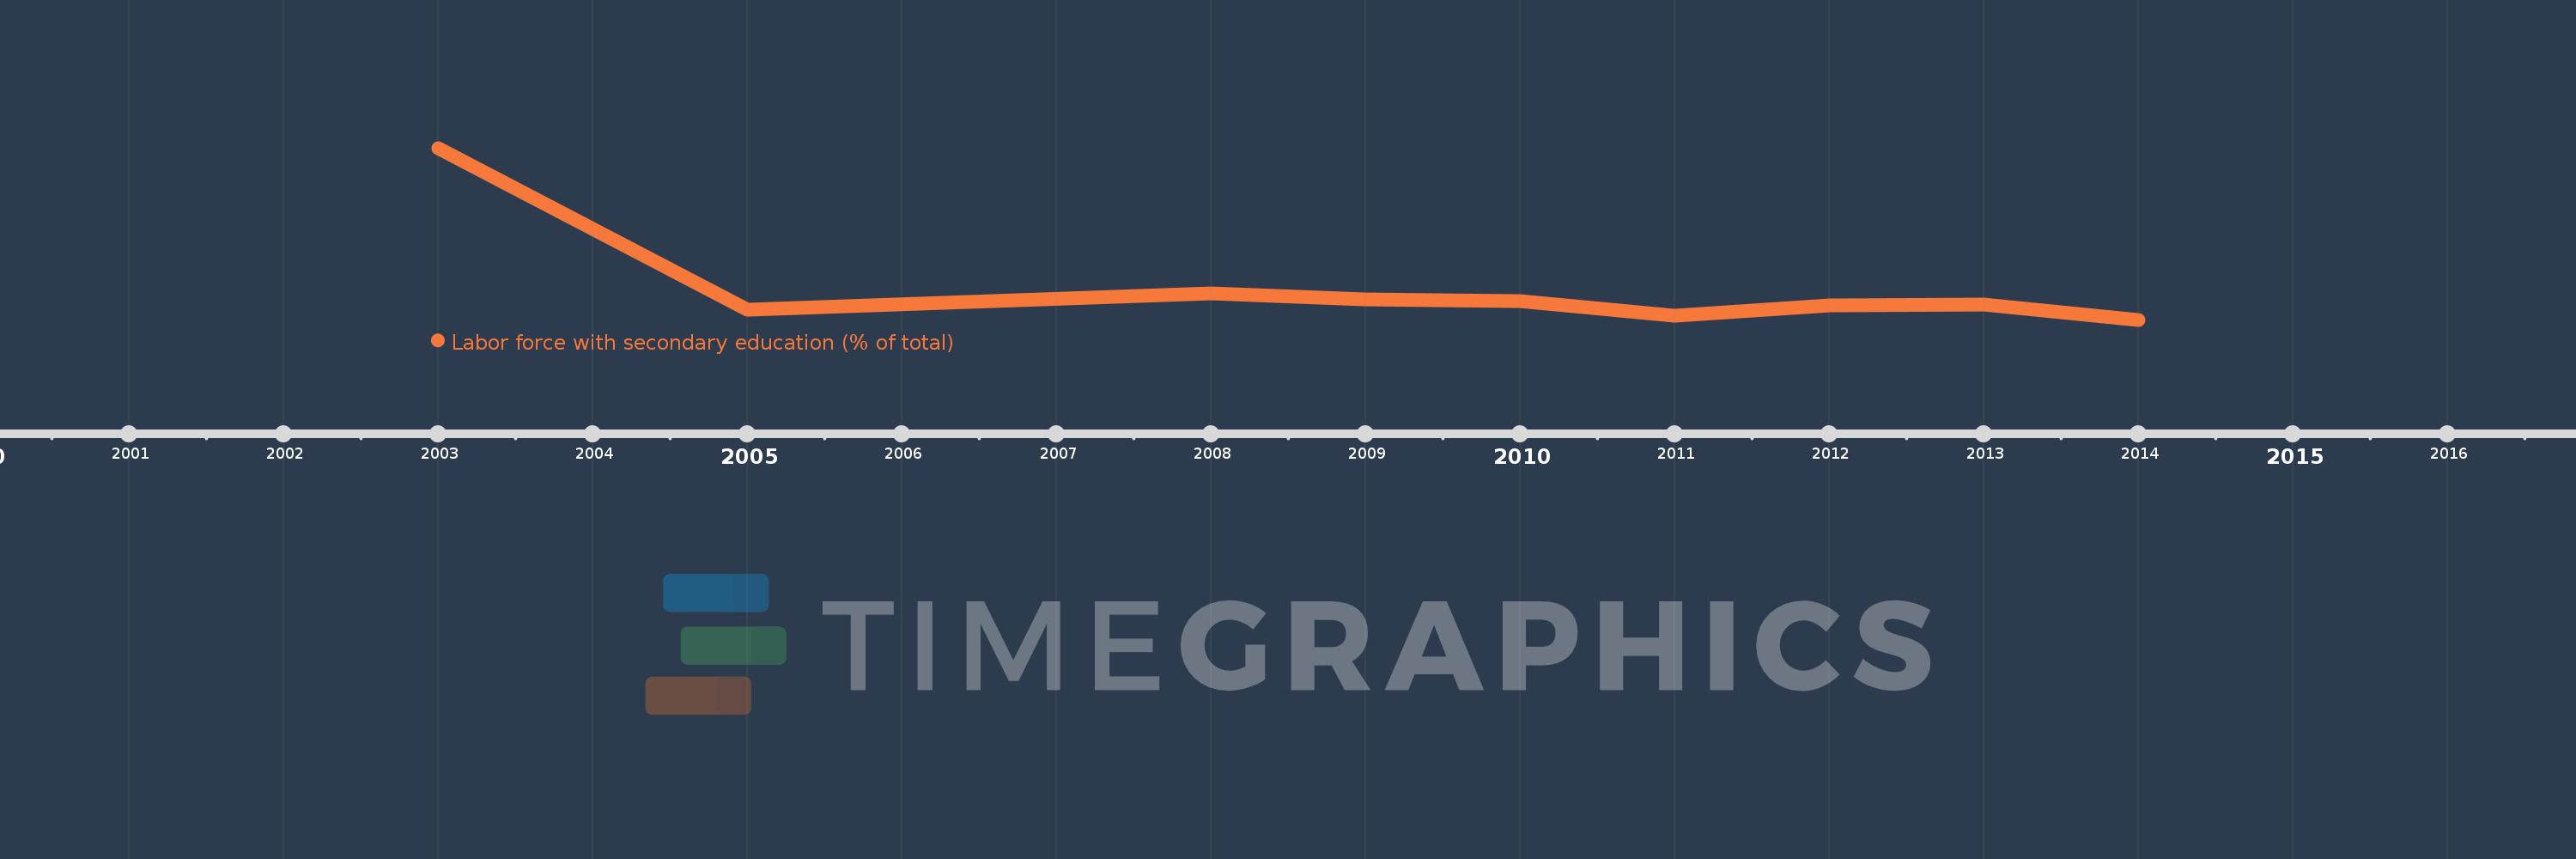
Labor force with secondary education (% of total)
2014,2013,2012,2011,2010,2009,2008,2005,2003
This statistics in other country:
Timeline:
This timeline shows a graph from 2003 to 2014 of Europe & Central Asia (excluding high income). No data until 2002. Number of actual observations by date: 9.
Source name:
World Development Indicators
Source organization:
International Labour Organization, Key Indicators of the Labour Market database.
Categories, topics:
Education, Social Protection & Labor
Last updated:
apr 23, 2017
Indicators value changes by year
Minimum:
39.794
jan 1, 2014
Maximum:
54.853
jan 1, 2003
At the date of observation
Value
Absolute change
Change from previous value
jan 1, 2003
54.853
+54.853
0.0%
jan 1, 2005
40.655
-14.198
-25.88%
jan 1, 2008
42.076
+1.421
3.5%
jan 1, 2009
41.594
-0.482
-1.15%
jan 1, 2010
41.433
-0.161
-0.39%
jan 1, 2011
40.135
-1.298
-3.13%
jan 1, 2012
41.049
+0.914
2.28%
jan 1, 2013
41.091
+0.042
0.1%
jan 1, 2014
39.794
-1.297
-3.16%
Ranking of countries by current statistics by years


Comments: