29
/
en
AIzaSyAYiBZKx7MnpbEhh9jyipgxe19OcubqV5w
April 1, 2024
42558
Latin America & Caribbean (excluding high income)
LAC
false
2
1
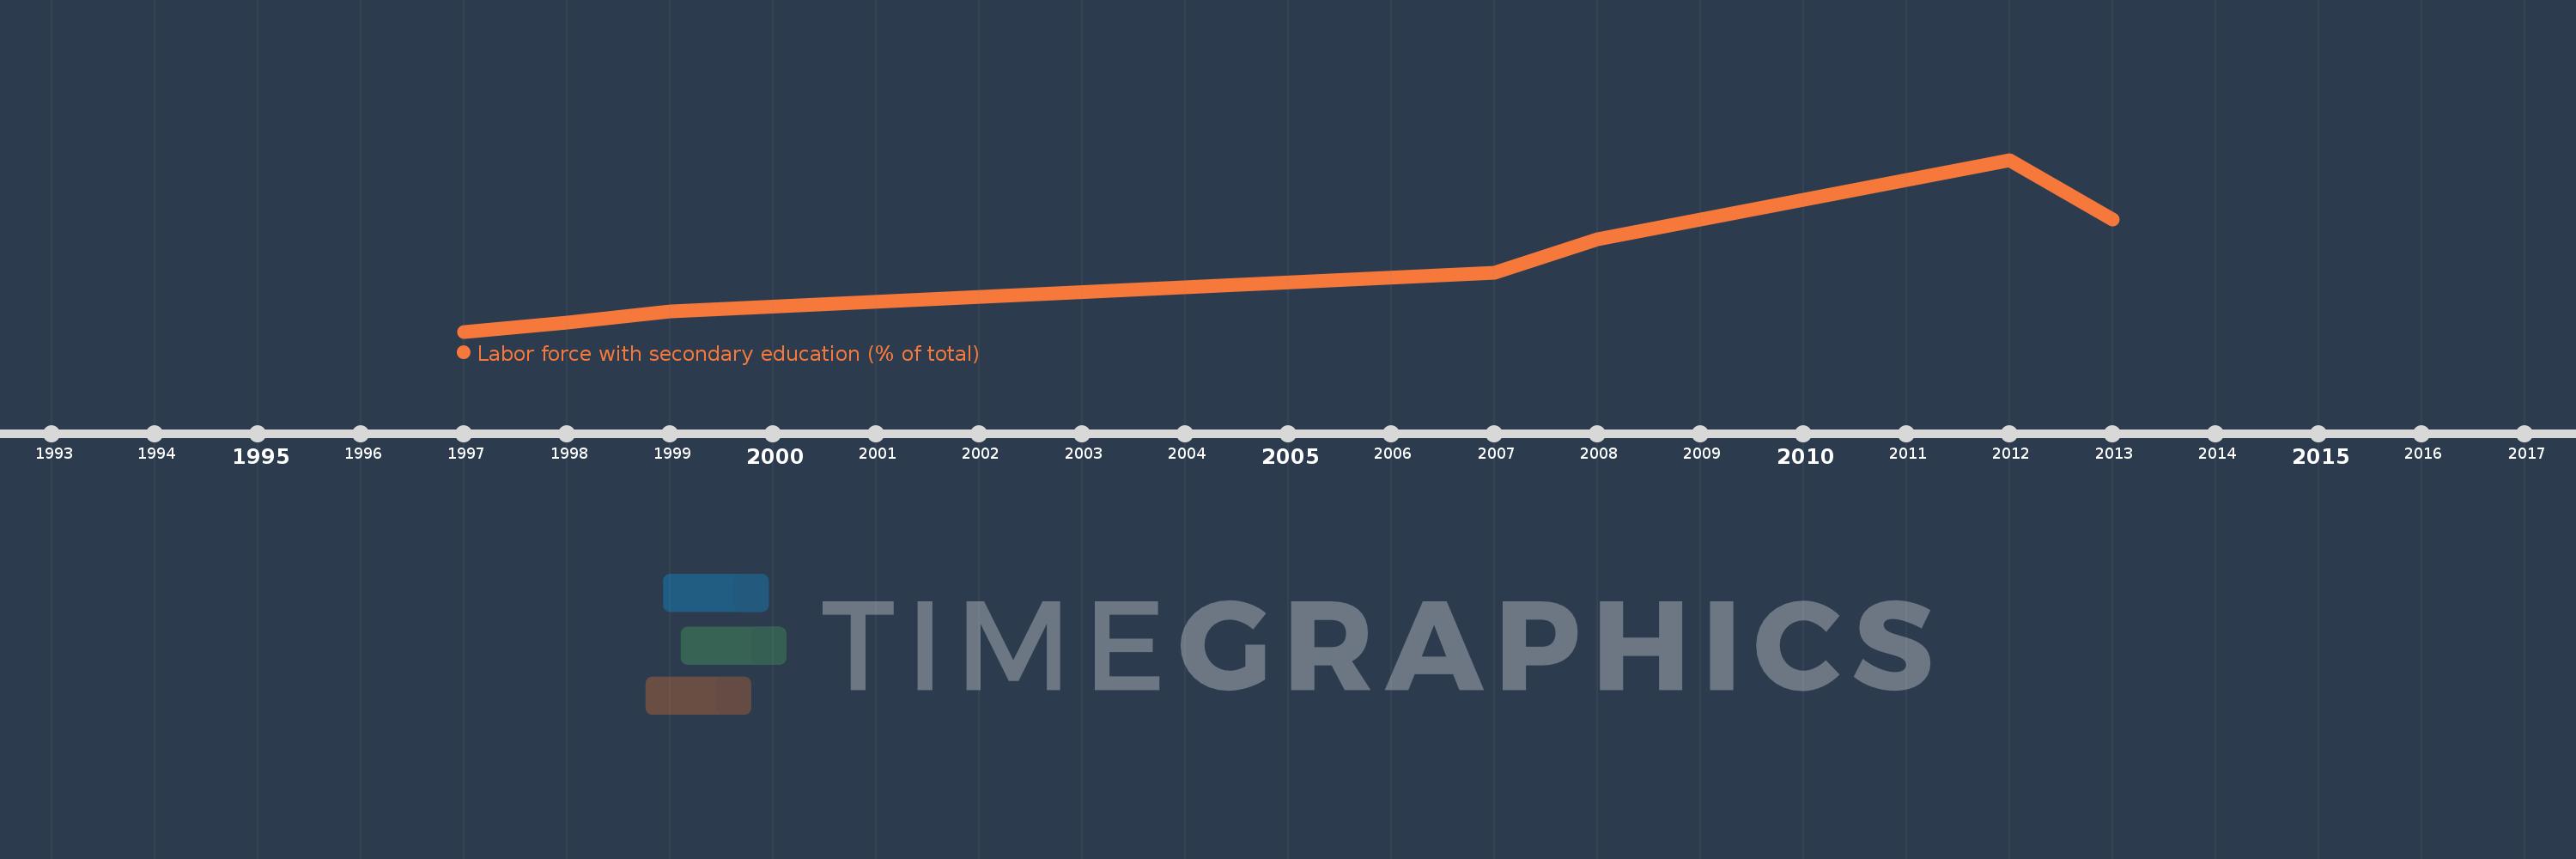
Labor force with secondary education (% of total)
2013,2012,2008,2007,1999,1998,1997
This statistics in other country:
Timeline:
This timeline shows a graph from 1997 to 2013 of Latin America & Caribbean (excluding high income). No data until 1996. Number of actual observations by date: 7.
Source name:
World Development Indicators
Source organization:
International Labour Organization, Key Indicators of the Labour Market database.
Categories, topics:
Education, Social Protection & Labor
Last updated:
apr 23, 2017
Indicators value changes by year
Minimum:
21.933
jan 1, 1997
Maximum:
39.601
jan 1, 2012
At the date of observation
Value
Absolute change
Change from previous value
jan 1, 1997
21.933
+21.933
0.0%
jan 1, 1998
22.848
+0.915
4.17%
jan 1, 1999
23.967
+1.119
4.9%
jan 1, 2007
27.959
+3.992
16.66%
jan 1, 2008
31.459
+3.5
12.52%
jan 1, 2012
39.601
+8.142
25.88%
jan 1, 2013
33.463
-6.138
-15.5%
Ranking of countries by current statistics by years


Comments: