30
/it/
AIzaSyAYiBZKx7MnpbEhh9jyipgxe19OcubqV5w
April 1, 2024
31757
Europe & Central Asia (excluding high income)
ECA
false
2
1
Labor force with secondary education (% of total)
2014,2013,2012,2011,2010,2009,2008,2005,2003
Download
Biblioteca di statistiche globali →Europe & Central Asia (excluding high income) →

Labor force with secondary education (% of total)

Queste statistiche in altri paesi:

AlbaniaAlgeriaAntigua and BarbudaArgentinaArmeniaArubaAustraliaAustriaAzerbaijanBahamas, TheBahrainBarbadosBelarusBelgiumBelizeBermudaBoliviaBosnia and HerzegovinaBotswanaBrazilBritish Virgin IslandsBulgariaCambodiaCanadaCayman IslandsCentral Europe and the BalticsChadChileColombiaCosta RicaCroatiaCubaCyprusCzech RepublicDenmarkDominicaDominican RepublicEarly-demographic dividendEcuadorEgypt, Arab Rep.El SalvadorEstoniaEthiopiaEuro areaEurope & Central AsiaEurope & Central Asia (excluding high income)Europe & Central Asia (IDA & IBRD countries)European UnionFinlandFranceFrench PolynesiaGeorgiaGermanyGhanaGreeceGuatemalaGuyanaHigh incomeHondurasHong Kong SAR, ChinaHungaryIcelandIndiaIndonesiaIran, Islamic Rep.IrelandIsraelItalyJapanJordanKazakhstanKorea, Rep.KosovoKuwaitKyrgyz RepublicLatin America & Caribbean Latin America & Caribbean (excluding high income)Latin America & the Caribbean (IDA & IBRD countries)LatviaLebanonLithuaniaLuxembourgMacao SAR, ChinaMacedonia, FYRMadagascarMalaysiaMaltaMauritiusMexicoMoldovaMongoliaMontenegroMoroccoNamibiaNepalNetherlandsNew CaledoniaNew ZealandNicaraguaNigerNigeriaNorth AmericaNorwayOECD membersOmanPakistanPanamaParaguayPeruPhilippinesPolandPortugalPost-demographic dividendRomaniaRussian FederationRwandaSan MarinoSaudi ArabiaSerbiaSingaporeSlovak RepublicSloveniaSouth AfricaSouth AsiaSouth Asia (IDA & IBRD)SpainSri LankaSt. Kitts and NevisSt. LuciaSt. Vincent and the GrenadinesSwedenSwitzerlandSyrian Arab RepublicTajikistanThailandTimor-LesteTrinidad and TobagoTunisiaTurkeyUgandaUkraineUnited Arab EmiratesUnited KingdomUnited StatesUruguayVenezuela, RBWest Bank and GazaYemen, Rep.

Linea del tempo:

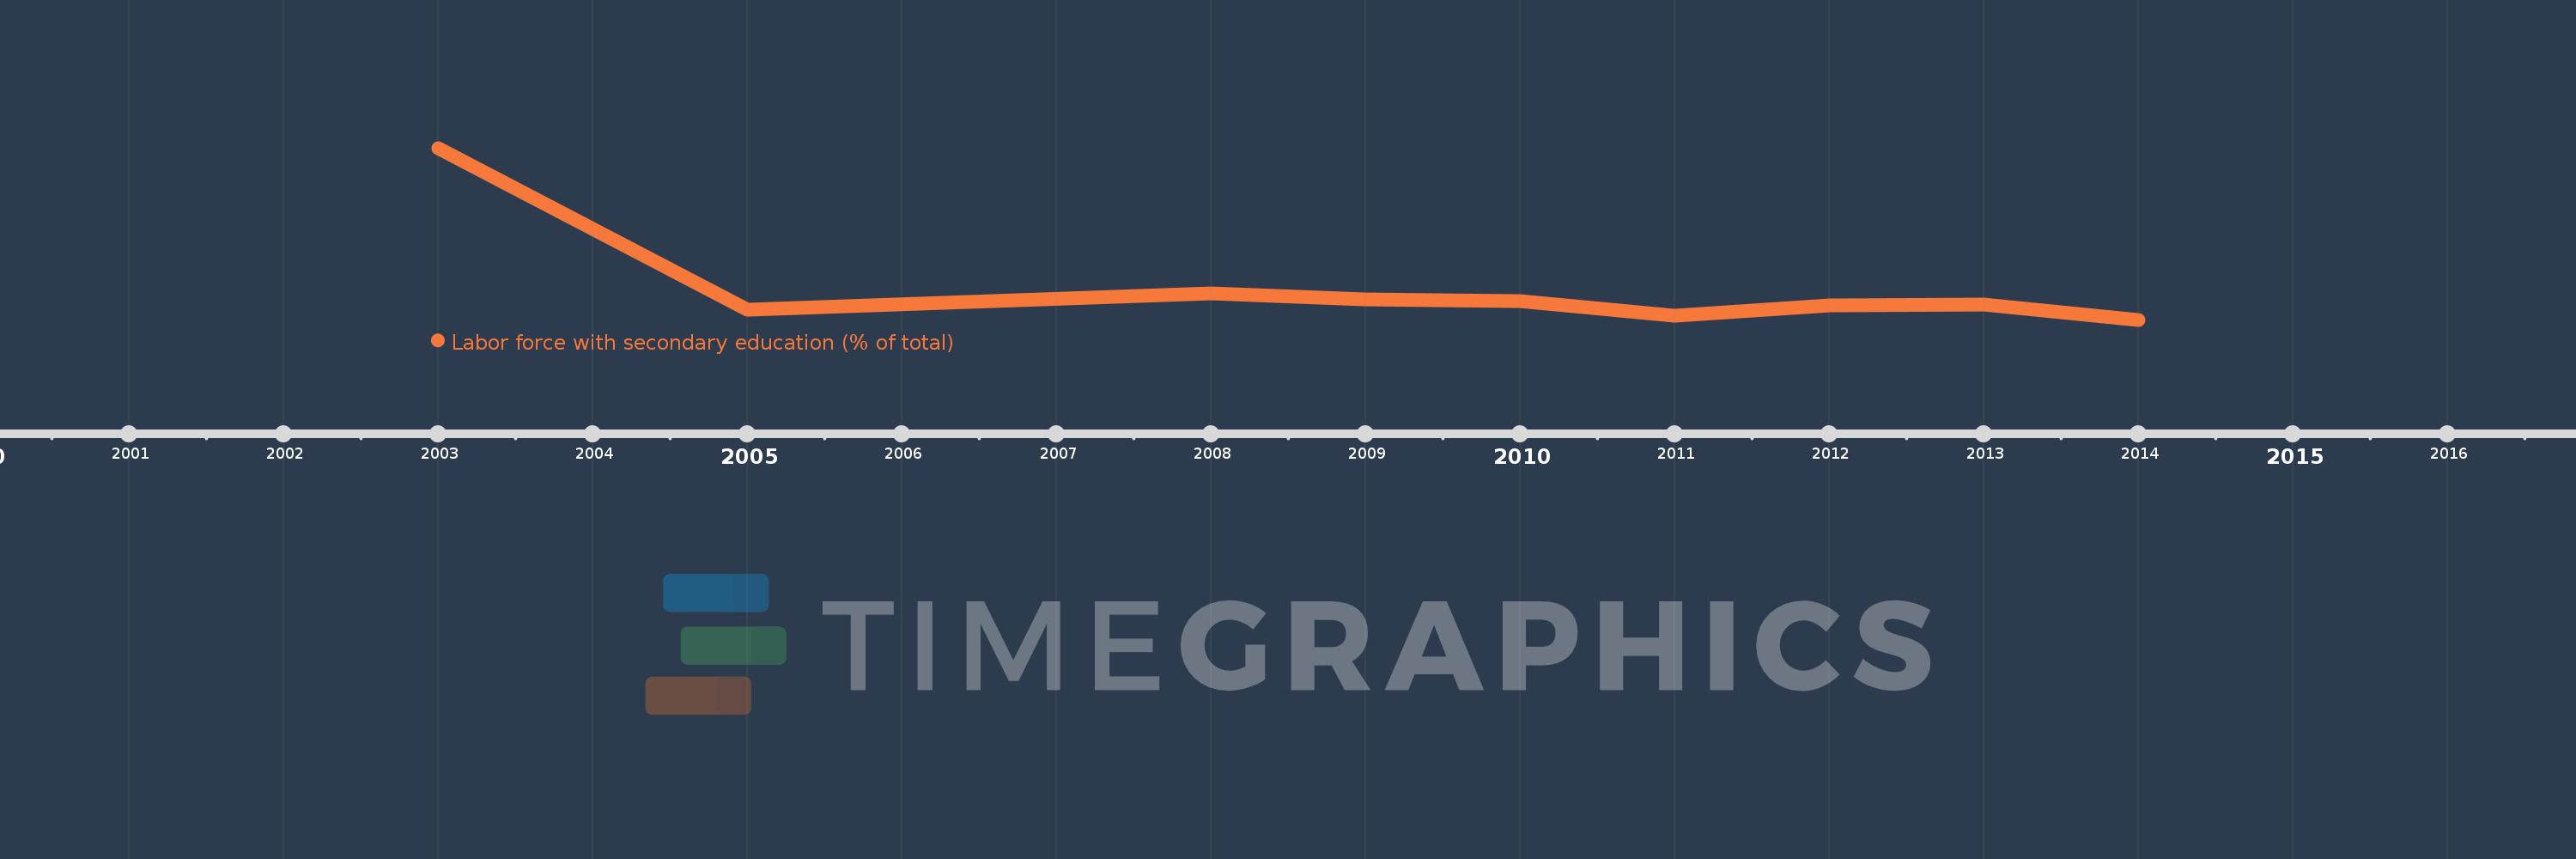
Questa scala temporale mostra un grafico dal 2003 anno al 2014 anno. Europe & Central Asia (excluding high income). I dati fino ad 2002 anno non disponibili. Il numero di osservazioni attuali secondo i date: 9.

La fonte (nome):

Indicatori dello sviluppo mondiale

La fonte (organizzazione):

International Labour Organization, Key Indicators of the Labour Market database.

Categorie:

Education, Social Protection & Labor

sono stati aggiornati

23 apr 2017 anni

Indicatori delle variazioni dei valori per anni

In media:
42.52
Minima:
39.794
1 gen 2014 anni
Massimo:
54.853
1 gen 2003 anni
Alla data di osservazione
Valore
Variazione assoluta
La variazione rispetto al valore precedente
1 gen 2003 anni
54.853
+54.853
0.0%
1 gen 2005 anni
40.655
-14.198
-25.88%
1 gen 2008 anni
42.076
+1.421
3.5%
1 gen 2009 anni
41.594
-0.482
-1.15%
1 gen 2010 anni
41.433
-0.161
-0.39%
1 gen 2011 anni
40.135
-1.298
-3.13%
1 gen 2012 anni
41.049
+0.914
2.28%
1 gen 2013 anni
41.091
+0.042
0.1%
1 gen 2014 anni
39.794
-1.297
-3.16%

Classificazione dei paesi secondo i statistiche attuali per anni